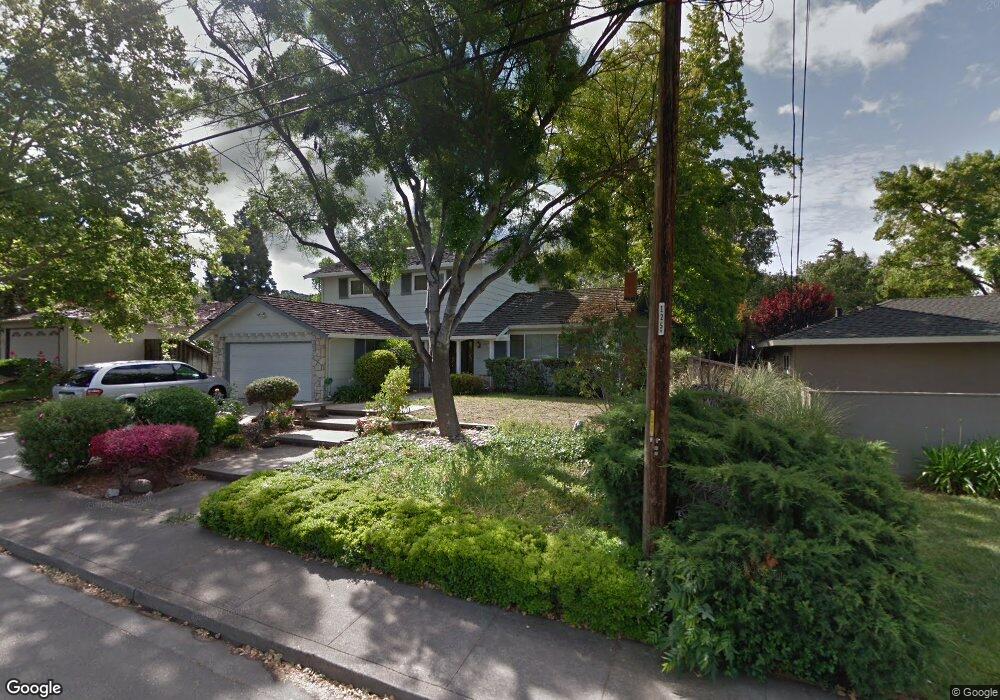
3545 Tupelo Dr Walnut Creek, CA 94598
Woodlands NeighborhoodEstimated Value: $1,267,000 - $1,472,000
4
Beds
3
Baths
2,400
Sq Ft
$577/Sq Ft
Est. Value
About This Home
This home is located at 3545 Tupelo Dr, Walnut Creek, CA 94598 and is currently estimated at $1,385,550, approximately $577 per square foot. 3545 Tupelo Dr is a home located in Contra Costa County with nearby schools including Valle Verde Elementary School, Foothill Middle School, and Northgate High School.
Ownership History
Date
Name
Owned For
Owner Type
Purchase Details
Closed on
Feb 22, 2021
Sold by
Saweres Bassem R and Saweres Nancy E
Bought by
Saweres Bassem R and Saweres Nancy E
Current Estimated Value
Purchase Details
Closed on
Jan 20, 2011
Sold by
Saweres Bassem and Saweres Nancy
Bought by
Saweres Bassem R and Saweres Nancy E
Purchase Details
Closed on
Sep 20, 2010
Sold by
Saweres Bassem and Saweres Nancy
Bought by
Saweres Bassem and Saweres Nancy
Purchase Details
Closed on
Jul 7, 2003
Sold by
Loyer Henry W and Loyer Dorothy G
Bought by
Saweres Bassem and Elias Nancy
Home Financials for this Owner
Home Financials are based on the most recent Mortgage that was taken out on this home.
Original Mortgage
$506,000
Outstanding Balance
$213,342
Interest Rate
5.15%
Mortgage Type
Purchase Money Mortgage
Estimated Equity
$1,172,208
Create a Home Valuation Report for This Property
The Home Valuation Report is an in-depth analysis detailing your home's value as well as a comparison with similar homes in the area
Home Values in the Area
Average Home Value in this Area
Purchase History
| Date | Buyer | Sale Price | Title Company |
|---|---|---|---|
| Saweres Bassem R | -- | Old Republic Title Company | |
| Saweres Bassem R | -- | None Available | |
| Saweres Bassem | -- | Fidelity National Title Co | |
| Saweres Bassem | $632,500 | Old Republic Title |
Source: Public Records
Mortgage History
| Date | Status | Borrower | Loan Amount |
|---|---|---|---|
| Open | Saweres Bassem | $506,000 | |
| Closed | Saweres Bassem | $94,800 |
Source: Public Records
Tax History
| Year | Tax Paid | Tax Assessment Tax Assessment Total Assessment is a certain percentage of the fair market value that is determined by local assessors to be the total taxable value of land and additions on the property. | Land | Improvement |
|---|---|---|---|---|
| 2025 | $10,811 | $899,266 | $582,926 | $316,340 |
| 2024 | $10,391 | $881,635 | $571,497 | $310,138 |
| 2023 | $10,391 | $864,349 | $560,292 | $304,057 |
| 2022 | $10,301 | $847,402 | $549,306 | $298,096 |
| 2021 | $10,073 | $830,787 | $538,536 | $292,251 |
| 2019 | $9,863 | $806,147 | $522,563 | $283,584 |
| 2018 | $9,509 | $790,341 | $512,317 | $278,024 |
| 2017 | $9,210 | $774,845 | $502,272 | $272,573 |
| 2016 | $8,994 | $759,653 | $492,424 | $267,229 |
| 2015 | $8,934 | $748,243 | $485,028 | $263,215 |
| 2014 | $8,065 | $666,500 | $432,040 | $234,460 |
Source: Public Records
Map
Nearby Homes
- 3565 Tupelo Dr
- 3586 Tupelo Dr
- 102 Kelobra Ct
- 3651 Perada Dr
- 326 Dogwood Dr
- 442 Candleberry Rd
- 280 Firestone Dr
- 3016 Stinson Cir
- 3139 Deerpark Dr
- 3460 Sutcliffe Ct
- 3104 Kirby Ln
- 3114 Santa Paula Dr
- 3318 Ellesmere Ct
- 131 Corte Del Prado
- 3055 Treat Blvd Unit 36
- 599 Timberleaf Ct
- 3374 Whitehaven Dr
- 625 Filbert Ct
- 810 Oak Grove Rd Unit 104
- 2890 Treat Blvd Unit 5
- 3535 Tupelo Dr
- 3555 Tupelo Dr
- 3536 Perada Dr
- 3530 Perada Dr
- 3542 Perada Dr
- 3525 Tupelo Dr
- 3546 Tupelo Dr
- 3524 Perada Dr
- 3536 Tupelo Dr
- 3556 Tupelo Dr
- 3548 Perada Dr
- 3526 Tupelo Dr
- 3515 Tupelo Dr
- 3566 Tupelo Dr
- 3575 Tupelo Dr
- 3518 Perada Dr
- 3560 Perada Dr
- 3516 Tupelo Dr
- 3521 Bayberry Dr
- 3576 Tupelo Dr
Your Personal Tour Guide
Ask me questions while you tour the home.