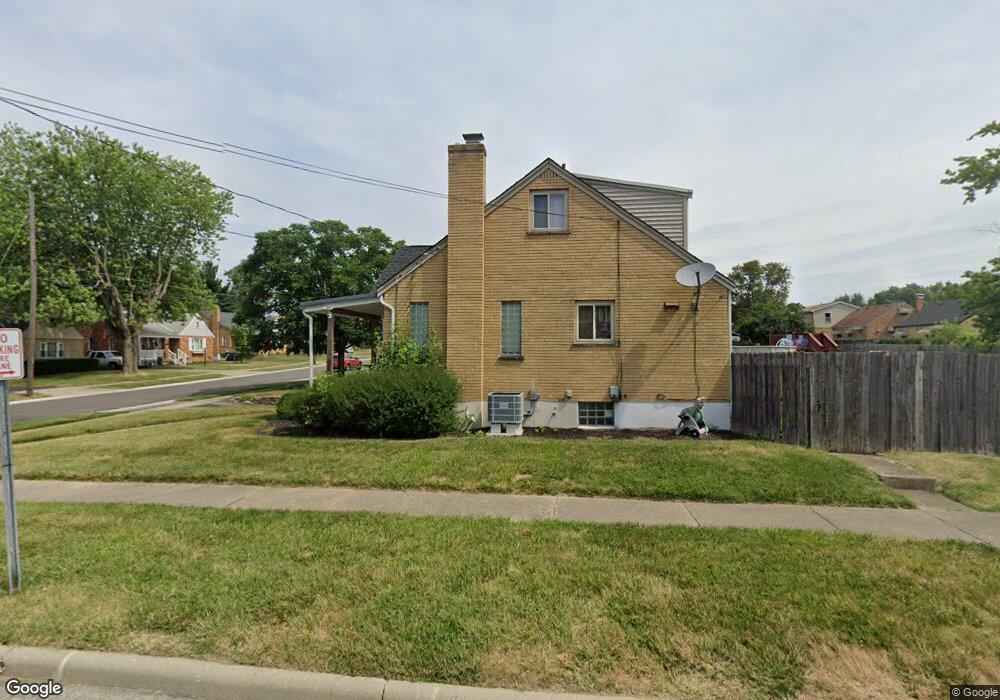
3546 Coral Gables Rd Cincinnati, OH 45248
Estimated Value: $203,000 - $280,000
4
Beds
2
Baths
1,739
Sq Ft
$138/Sq Ft
Est. Value
About This Home
This home is located at 3546 Coral Gables Rd, Cincinnati, OH 45248 and is currently estimated at $239,984, approximately $138 per square foot. 3546 Coral Gables Rd is a home located in Hamilton County with nearby schools including Oakdale Elementary School, Bridgetown Middle School, and Oak Hills High School.
Ownership History
Date
Name
Owned For
Owner Type
Purchase Details
Closed on
Jan 22, 2003
Sold by
Plae Llc
Bought by
Rischmann Nicole R
Current Estimated Value
Purchase Details
Closed on
Dec 16, 2002
Sold by
Mann John A and Mann Teresa A
Bought by
Plae Llc
Purchase Details
Closed on
Apr 28, 1997
Sold by
Clausing Gregory J and Clausing Florence R
Bought by
Mann John A and Mann Teresa A
Home Financials for this Owner
Home Financials are based on the most recent Mortgage that was taken out on this home.
Original Mortgage
$76,000
Interest Rate
8.05%
Create a Home Valuation Report for This Property
The Home Valuation Report is an in-depth analysis detailing your home's value as well as a comparison with similar homes in the area
Home Values in the Area
Average Home Value in this Area
Purchase History
| Date | Buyer | Sale Price | Title Company |
|---|---|---|---|
| Rischmann Nicole R | $118,900 | -- | |
| Plae Llc | $87,100 | -- | |
| Mann John A | $85,000 | -- |
Source: Public Records
Mortgage History
| Date | Status | Borrower | Loan Amount |
|---|---|---|---|
| Previous Owner | Mann John A | $76,000 |
Source: Public Records
Tax History Compared to Growth
Tax History
| Year | Tax Paid | Tax Assessment Tax Assessment Total Assessment is a certain percentage of the fair market value that is determined by local assessors to be the total taxable value of land and additions on the property. | Land | Improvement |
|---|---|---|---|---|
| 2024 | $3,180 | $59,452 | $10,476 | $48,976 |
| 2023 | $3,126 | $59,452 | $10,476 | $48,976 |
| 2022 | $2,697 | $43,635 | $9,349 | $34,286 |
| 2021 | $2,478 | $43,635 | $9,349 | $34,286 |
| 2020 | $2,449 | $43,635 | $9,349 | $34,286 |
| 2019 | $2,408 | $38,959 | $8,348 | $30,611 |
| 2018 | $2,410 | $38,959 | $8,348 | $30,611 |
| 2017 | $2,302 | $38,959 | $8,348 | $30,611 |
| 2016 | $2,430 | $40,642 | $8,575 | $32,067 |
| 2015 | $2,418 | $40,642 | $8,575 | $32,067 |
| 2014 | $2,418 | $40,642 | $8,575 | $32,067 |
| 2013 | $2,286 | $41,056 | $8,663 | $32,393 |
Source: Public Records
Map
Nearby Homes
- 3558 Neiheisel Ave
- 5988 N Glen Rd
- 3605 Coral Gables Rd
- 5869 Weston Ct
- 3699 Krierview Dr
- 3668 Castlewood Ln
- 5719 Biscayne Ave
- 2 Ebenezer Rd
- 5696 Biscayne Ave
- 3492 Moonridge Dr
- 5647 Childs Ave
- 3832 Ebenezer Rd
- 3219 Lakepointe Ct
- 3316 Moonridge Dr
- 5696 Bridgetown Rd Unit 13
- 5658 Bridgetown Rd
- 5809 Harborpoint Dr
- 3961 Hutchinson Rd
- 5895 Quailhill Dr
- 6492 Sherrybrook Dr
- 3552 Coral Gables Rd
- 3558 Coral Gables Rd
- 3547 Neiheisel Ave
- 3553 Neiheisel Ave
- 3564 Coral Gables Rd
- 3559 Neiheisel Ave
- 5953 N Glen Rd
- 5957 N Glen Rd
- 3553 Coral Gables Rd
- 5949 N Glen Rd
- 3565 Neiheisel Ave
- 3559 Coral Gables Rd
- 3570 Coral Gables Rd
- 5943 N Glen Rd
- 5965 N Glen Rd
- 3565 Coral Gables Rd
- 5939 N Glen Rd
- 3571 Neiheisel Ave
- 5969 N Glen Rd
- 3576 Coral Gables Rd