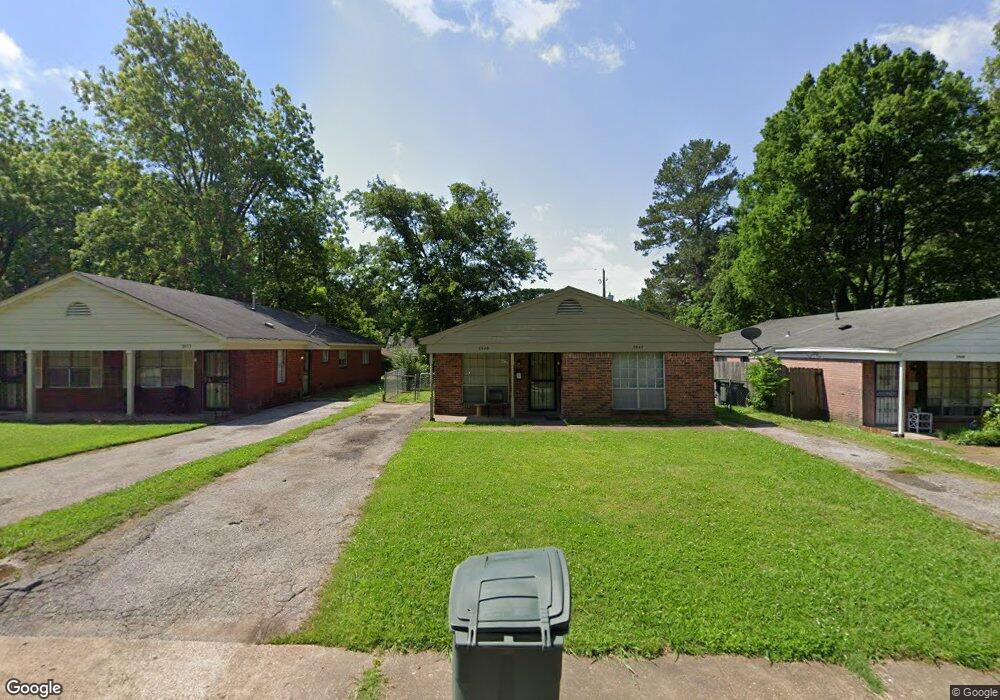
3547 Clayphil Ave Memphis, TN 38111
Audubon Park NeighborhoodEstimated Value: $137,000 - $190,000
4
Beds
2
Baths
1,612
Sq Ft
$104/Sq Ft
Est. Value
About This Home
This home is located at 3547 Clayphil Ave, Memphis, TN 38111 and is currently estimated at $168,006, approximately $104 per square foot. 3547 Clayphil Ave is a home located in Shelby County with nearby schools including Sherwood Elementary School, Sherwood Middle, and Melrose High School.
Ownership History
Date
Name
Owned For
Owner Type
Purchase Details
Closed on
Aug 22, 2019
Sold by
County Of Shelby
Bought by
Torrey Paul
Current Estimated Value
Purchase Details
Closed on
Dec 7, 2017
Sold by
P & H Properties Of Memphis Llc
Bought by
Pino Jona
Purchase Details
Closed on
Dec 2, 2016
Sold by
Pino Jona
Bought by
P And H Properties Of Memphis Llc
Purchase Details
Closed on
Jun 18, 2010
Sold by
County Of Shelby
Bought by
Trustees Triumph In Christ Ministries In
Purchase Details
Closed on
Dec 14, 2004
Sold by
Taxpayers Delinquent
Bought by
Unik Properties Ltd
Purchase Details
Closed on
Mar 15, 2004
Sold by
Savage Van and Savage Cora
Bought by
True Love Outreach Ministries
Purchase Details
Closed on
Jul 10, 1998
Sold by
Lazarov Paul G
Bought by
Pino Johna and Kotoff Aurelia
Purchase Details
Closed on
Jun 3, 1997
Sold by
Notowitz Max and Delugach Ann
Bought by
Savage Van
Create a Home Valuation Report for This Property
The Home Valuation Report is an in-depth analysis detailing your home's value as well as a comparison with similar homes in the area
Home Values in the Area
Average Home Value in this Area
Purchase History
| Date | Buyer | Sale Price | Title Company |
|---|---|---|---|
| Torrey Paul | -- | None Available | |
| Pino Jona | -- | None Available | |
| P And H Properties Of Memphis Llc | -- | None Available | |
| Trustees Triumph In Christ Ministries In | $1,000 | None Available | |
| Unik Properties Ltd | $5,900 | -- | |
| True Love Outreach Ministries | -- | -- | |
| Pino Johna | $59,000 | -- | |
| Savage Van | -- | -- |
Source: Public Records
Tax History Compared to Growth
Tax History
| Year | Tax Paid | Tax Assessment Tax Assessment Total Assessment is a certain percentage of the fair market value that is determined by local assessors to be the total taxable value of land and additions on the property. | Land | Improvement |
|---|---|---|---|---|
| 2025 | $1,169 | $65,880 | $9,000 | $56,880 |
| 2024 | $1,169 | $34,480 | $7,200 | $27,280 |
| 2023 | $2,100 | $34,480 | $7,200 | $27,280 |
| 2022 | $2,100 | $34,480 | $7,200 | $27,280 |
| 2021 | $2,125 | $34,480 | $7,200 | $27,280 |
| 2020 | $1,907 | $26,320 | $7,200 | $19,120 |
| 2019 | $1,907 | $26,320 | $7,200 | $19,120 |
| 2018 | $1,907 | $26,320 | $7,200 | $19,120 |
| 2017 | $1,082 | $26,320 | $7,200 | $19,120 |
| 2016 | $1,120 | $25,640 | $0 | $0 |
| 2014 | $1,120 | $25,640 | $0 | $0 |
Source: Public Records
Map
Nearby Homes
- 3549 Marion Ave
- 3547 Spottswood Ave
- 3610 Kearney Ave
- 3654 Douglass Ave
- 3465 Spottswood Ave
- 3636 Spottswood Ave Unit 1
- 749 Echles Ct
- 3646 Spottswood Ave Unit 10
- 3687 Spottswood Ave
- 3663 Park Ave
- 719 Echles St
- 3438 Carrington Rd
- 3628 Carrington Rd
- 3482 Hadley Rd
- 3449 Carrington Rd
- 3725 Spottswood Ave
- 3423 Carrington Rd
- 3397 Southern Ave
- 3739 Spottswood Ave
- 886 Echles St
- 3543 Clayphil Ave Unit 1
- 3543 Clayphil Ave
- 3553 Clayphil Ave
- 3537 Clayphil Ave
- 3557 Clayphil Ave
- 3539 Clayphil Ave
- 3563 Clayphil Ave
- 3533 Clayphil Ave
- 3550 Douglass Ave
- 3554 Douglass Ave
- 3549 Carnes Ave
- 3560 Douglass Ave
- 3540 Douglass Ave
- 3543 Carnes Ave
- 3553 Carnes Ave
- 3527 Clayphil Ave
- 3539 Carnes Ave
- 3559 Carnes Ave
- 3564 Douglass Ave
- 3534 Douglass Ave