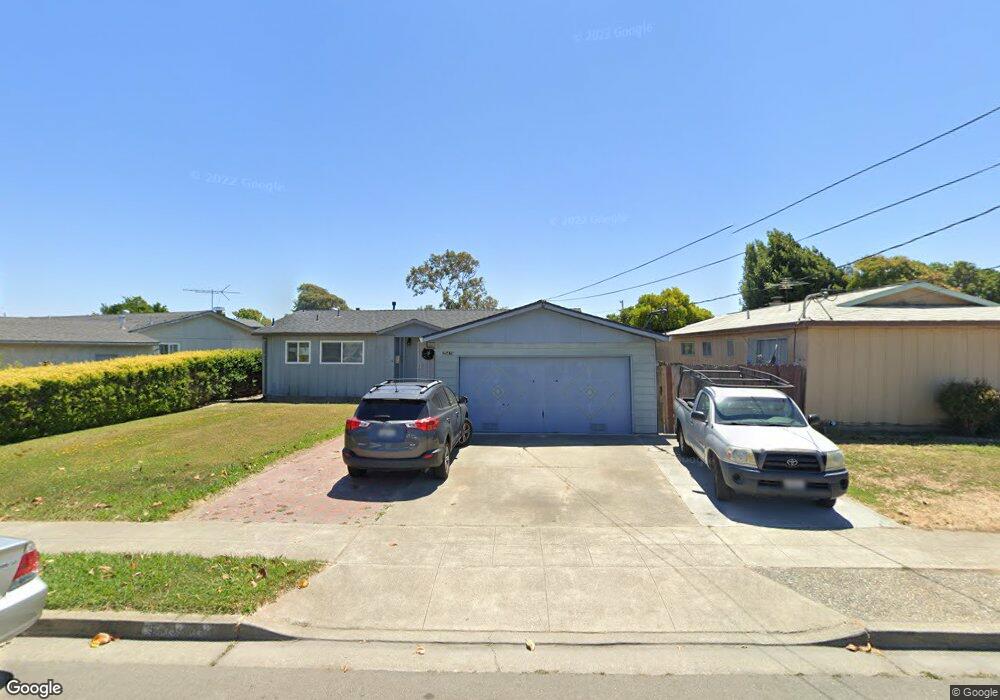
35479 Orleans Dr Newark, CA 94560
Estimated Value: $983,000 - $1,110,000
3
Beds
2
Baths
1,100
Sq Ft
$971/Sq Ft
Est. Value
About This Home
This home is located at 35479 Orleans Dr, Newark, CA 94560 and is currently estimated at $1,068,209, approximately $971 per square foot. 35479 Orleans Dr is a home located in Alameda County with nearby schools including Newark Junior High School, Newark Memorial High School, and Challenger School - Ardenwood.
Ownership History
Date
Name
Owned For
Owner Type
Purchase Details
Closed on
Feb 25, 2010
Sold by
Hsbc Bank Usa National Association
Bought by
Wu Xingzhang
Current Estimated Value
Home Financials for this Owner
Home Financials are based on the most recent Mortgage that was taken out on this home.
Original Mortgage
$262,500
Interest Rate
5.01%
Mortgage Type
New Conventional
Purchase Details
Closed on
Nov 13, 2009
Sold by
Flores Hector and Flores Yolanda
Bought by
Hsbc Bank Usa National Association
Purchase Details
Closed on
Mar 23, 2005
Sold by
Rodriguez Mary R
Bought by
Flores Hector and Flores Yolanda
Home Financials for this Owner
Home Financials are based on the most recent Mortgage that was taken out on this home.
Original Mortgage
$440,000
Interest Rate
1%
Mortgage Type
Negative Amortization
Purchase Details
Closed on
Oct 4, 1993
Sold by
Trumbo Bruce E
Bought by
Rodriguez Mary R
Home Financials for this Owner
Home Financials are based on the most recent Mortgage that was taken out on this home.
Original Mortgage
$118,000
Interest Rate
6.98%
Create a Home Valuation Report for This Property
The Home Valuation Report is an in-depth analysis detailing your home's value as well as a comparison with similar homes in the area
Home Values in the Area
Average Home Value in this Area
Purchase History
| Date | Buyer | Sale Price | Title Company |
|---|---|---|---|
| Wu Xingzhang | $350,000 | Lawyers Title | |
| Hsbc Bank Usa National Association | $300,000 | None Available | |
| Flores Hector | $550,000 | Fidelity National Title Co | |
| Rodriguez Mary R | $178,000 | North American Title Company |
Source: Public Records
Mortgage History
| Date | Status | Borrower | Loan Amount |
|---|---|---|---|
| Previous Owner | Wu Xingzhang | $262,500 | |
| Previous Owner | Flores Hector | $440,000 | |
| Previous Owner | Rodriguez Mary R | $118,000 | |
| Closed | Flores Hector | $55,000 |
Source: Public Records
Tax History Compared to Growth
Tax History
| Year | Tax Paid | Tax Assessment Tax Assessment Total Assessment is a certain percentage of the fair market value that is determined by local assessors to be the total taxable value of land and additions on the property. | Land | Improvement |
|---|---|---|---|---|
| 2025 | $5,785 | $444,754 | $135,526 | $316,228 |
| 2024 | $5,785 | $435,900 | $132,870 | $310,030 |
| 2023 | $5,618 | $434,216 | $130,265 | $303,951 |
| 2022 | $5,534 | $418,704 | $127,711 | $297,993 |
| 2021 | $5,398 | $410,360 | $125,208 | $292,152 |
| 2020 | $5,292 | $413,083 | $123,925 | $289,158 |
| 2019 | $5,217 | $404,984 | $121,495 | $283,489 |
| 2018 | $5,136 | $397,046 | $119,114 | $277,932 |
| 2017 | $5,005 | $389,262 | $116,778 | $272,484 |
| 2016 | $4,946 | $381,632 | $114,489 | $267,143 |
| 2015 | $4,928 | $375,903 | $112,771 | $263,132 |
| 2014 | $4,791 | $368,542 | $110,562 | $257,980 |
Source: Public Records
Map
Nearby Homes
- 35421 Cleremont Dr
- 6354 Jarvis Ave
- 6740 Normandy Dr
- 6831 Cabernet Ave
- 6220 Jarvis Ave
- 36184 Toulouse St
- 36146 Indian Wells Dr
- 35914 Burning Tree Dr
- 7574 Birkdale Dr
- 36109 Dalewood Dr
- 36383 Colbert St
- 6025 Radcliffe Ave
- 36466 Haley St
- 5879 Caleb Ct
- 5303 Stirling Ct
- 36523 Cherry St
- 36535 Mulberry St
- 36563 Beutke Dr
- 36593 Leone St
- 36075 Crystal Springs Dr
- 35471 Orleans Dr
- 35493 Orleans Dr
- 35496 Cleremont Dr
- 35490 Cleremont Dr
- 35457 Orleans Dr
- 35505 Orleans Dr
- 35508 Cleremont Dr
- 35482 Cleremont Dr
- 35480 Orleans Dr
- 35486 Orleans Dr
- 35472 Orleans Dr
- 35519 Orleans Dr
- 35410 Cleremont Dr
- 35494 Orleans Dr
- 35446 Cleremont Dr
- 35458 Orleans Dr
- 35524 Cleremont Dr
- 35506 Orleans Dr
- 35191 Lido Blvd
- 35193 Lido Blvd