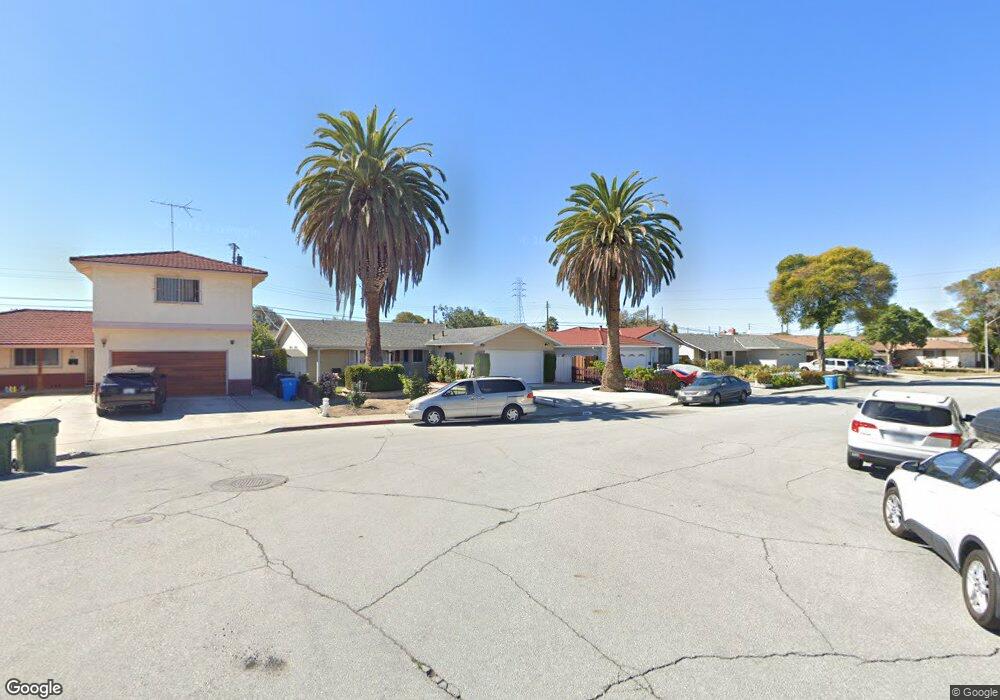
3548 Dinny St Santa Clara, CA 95054
North Santa Clara NeighborhoodEstimated Value: $1,245,000 - $1,332,315
3
Beds
2
Baths
1,097
Sq Ft
$1,177/Sq Ft
Est. Value
About This Home
This home is located at 3548 Dinny St, Santa Clara, CA 95054 and is currently estimated at $1,291,579, approximately $1,177 per square foot. 3548 Dinny St is a home located in Santa Clara County with nearby schools including Montague Elementary School, Buchser Middle School, and Santa Clara High School.
Ownership History
Date
Name
Owned For
Owner Type
Purchase Details
Closed on
Jan 20, 2005
Sold by
Ly Phuong My and Ly Phuong M
Bought by
Ly Phuong My
Current Estimated Value
Home Financials for this Owner
Home Financials are based on the most recent Mortgage that was taken out on this home.
Original Mortgage
$296,000
Outstanding Balance
$148,655
Interest Rate
5.67%
Mortgage Type
New Conventional
Estimated Equity
$1,142,924
Purchase Details
Closed on
Jan 18, 2002
Sold by
Ngo Daniel
Bought by
Ly Phuong M
Home Financials for this Owner
Home Financials are based on the most recent Mortgage that was taken out on this home.
Original Mortgage
$375,000
Interest Rate
7.11%
Mortgage Type
Stand Alone First
Purchase Details
Closed on
May 30, 1996
Sold by
Hang Kim K
Bought by
Tran Kim Ngoc
Home Financials for this Owner
Home Financials are based on the most recent Mortgage that was taken out on this home.
Original Mortgage
$140,000
Interest Rate
7.96%
Create a Home Valuation Report for This Property
The Home Valuation Report is an in-depth analysis detailing your home's value as well as a comparison with similar homes in the area
Home Values in the Area
Average Home Value in this Area
Purchase History
| Date | Buyer | Sale Price | Title Company |
|---|---|---|---|
| Ly Phuong My | -- | Fidelity National Title Ins | |
| Ly Phuong M | -- | Alliance Title Company | |
| Ly Phuong M | $380,000 | Alliance Title Company | |
| Tran Kim Ngoc | -- | Old Republic Title Company |
Source: Public Records
Mortgage History
| Date | Status | Borrower | Loan Amount |
|---|---|---|---|
| Open | Ly Phuong My | $296,000 | |
| Closed | Ly Phuong M | $375,000 | |
| Previous Owner | Tran Kim Ngoc | $140,000 |
Source: Public Records
Tax History Compared to Growth
Tax History
| Year | Tax Paid | Tax Assessment Tax Assessment Total Assessment is a certain percentage of the fair market value that is determined by local assessors to be the total taxable value of land and additions on the property. | Land | Improvement |
|---|---|---|---|---|
| 2025 | $6,455 | $561,357 | $252,610 | $308,747 |
| 2024 | $6,455 | $550,351 | $247,657 | $302,694 |
| 2023 | $6,388 | $539,560 | $242,801 | $296,759 |
| 2022 | $6,290 | $528,982 | $238,041 | $290,941 |
| 2021 | $6,263 | $518,611 | $233,374 | $285,237 |
| 2020 | $6,147 | $513,295 | $230,982 | $282,313 |
| 2019 | $6,140 | $503,231 | $226,453 | $276,778 |
| 2018 | $5,747 | $493,364 | $222,013 | $271,351 |
| 2017 | $5,717 | $483,691 | $217,660 | $266,031 |
| 2016 | $5,624 | $474,208 | $213,393 | $260,815 |
| 2015 | $5,600 | $467,086 | $210,188 | $256,898 |
| 2014 | $5,318 | $457,937 | $206,071 | $251,866 |
Source: Public Records
Map
Nearby Homes
- 783 Laurie Ave
- 930 Clyde Ave
- 920 Clyde Ave
- 1900 Chestnut St
- 1752 Beech St
- 3901 Lick Mill Blvd Unit 358
- 3901 Lick Mill Blvd Unit 430
- 3901 Lick Mill Blvd Unit 312
- 1883 Agnew Rd Unit 301
- 1883 Agnew Rd Unit 367
- 4012 Fitzpatrick Way Unit 3
- 2200 Agnew Rd Unit 212
- 2200 Agnew Rd Unit 118
- 1898 Garzoni Place
- 1901 Garzoni Place Unit 405
- 4503 Cheeney St
- 1861 Nelson Dr
- 4464 Laird Cir
- 4559 Laird Cir
- 4699 Snead Dr