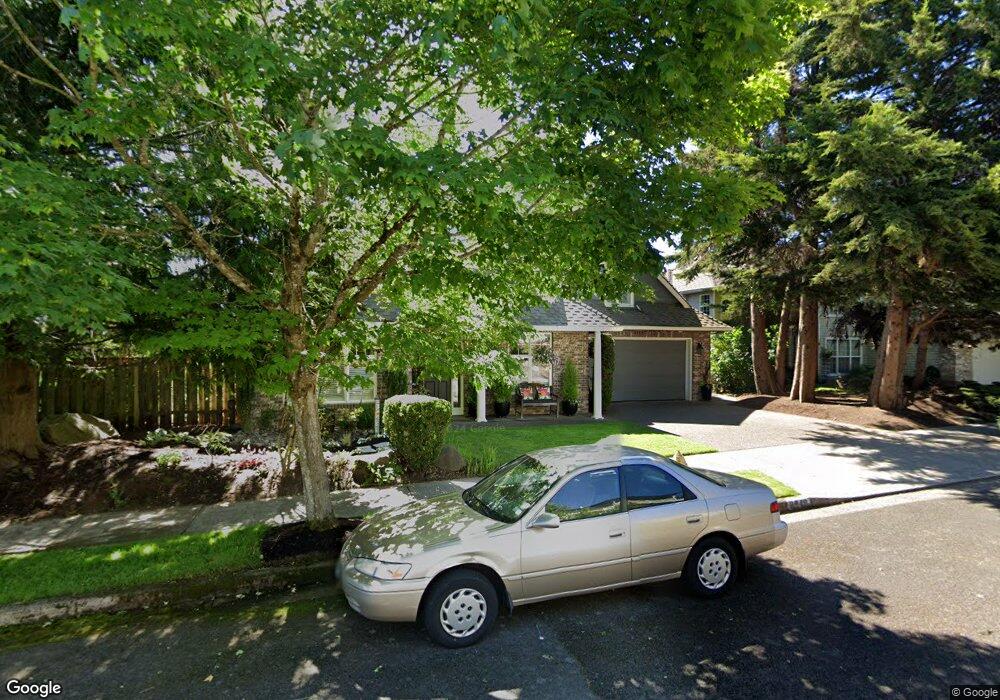
3549 Chelan Dr West Linn, OR 97068
Tanner Basin NeighborhoodEstimated Value: $807,839 - $934,000
4
Beds
7
Baths
2,520
Sq Ft
$337/Sq Ft
Est. Value
About This Home
This home is located at 3549 Chelan Dr, West Linn, OR 97068 and is currently estimated at $850,460, approximately $337 per square foot. 3549 Chelan Dr is a home located in Clackamas County with nearby schools including Sunset Primary School, Rosemont Ridge Middle School, and West Linn High School.
Ownership History
Date
Name
Owned For
Owner Type
Purchase Details
Closed on
Jul 31, 2007
Sold by
Erskine Jeanine and Mooney Jeanine
Bought by
Erskine Jeanine M and Jeanine M Erskine Revocable Living Trust
Current Estimated Value
Purchase Details
Closed on
Nov 17, 1999
Sold by
Halvorson Todd C and Halvorson Mary P
Bought by
Mooney Jeanine M
Home Financials for this Owner
Home Financials are based on the most recent Mortgage that was taken out on this home.
Original Mortgage
$85,000
Outstanding Balance
$25,645
Interest Rate
7.82%
Estimated Equity
$824,815
Purchase Details
Closed on
Jan 9, 1996
Sold by
R J Veenker Inc
Bought by
Halvorson Todd C and Halvorson Mary P
Home Financials for this Owner
Home Financials are based on the most recent Mortgage that was taken out on this home.
Original Mortgage
$196,400
Interest Rate
7.38%
Purchase Details
Closed on
Aug 15, 1994
Sold by
Koss Brod Goodrich & Associates Inc
Bought by
R J Veenker Inc
Create a Home Valuation Report for This Property
The Home Valuation Report is an in-depth analysis detailing your home's value as well as a comparison with similar homes in the area
Home Values in the Area
Average Home Value in this Area
Purchase History
| Date | Buyer | Sale Price | Title Company |
|---|---|---|---|
| Erskine Jeanine M | -- | None Available | |
| Mooney Jeanine M | $285,000 | Ticor Title Insurance | |
| Halvorson Todd C | $245,560 | Chicago Title Insurance Co | |
| R J Veenker Inc | $42,500 | Chicago Title Insurance Co |
Source: Public Records
Mortgage History
| Date | Status | Borrower | Loan Amount |
|---|---|---|---|
| Open | Mooney Jeanine M | $85,000 | |
| Previous Owner | Halvorson Todd C | $196,400 |
Source: Public Records
Tax History Compared to Growth
Tax History
| Year | Tax Paid | Tax Assessment Tax Assessment Total Assessment is a certain percentage of the fair market value that is determined by local assessors to be the total taxable value of land and additions on the property. | Land | Improvement |
|---|---|---|---|---|
| 2025 | $8,986 | $466,285 | -- | -- |
| 2024 | $8,650 | $452,704 | -- | -- |
| 2023 | $8,650 | $439,519 | $0 | $0 |
| 2022 | $8,164 | $426,718 | $0 | $0 |
| 2021 | $7,548 | $414,290 | $0 | $0 |
| 2020 | $7,495 | $402,224 | $0 | $0 |
| 2019 | $7,164 | $390,509 | $0 | $0 |
| 2018 | $6,823 | $379,135 | $0 | $0 |
| 2017 | $6,549 | $368,092 | $0 | $0 |
| 2016 | $6,283 | $357,371 | $0 | $0 |
| 2015 | $5,988 | $346,962 | $0 | $0 |
| 2014 | $5,651 | $336,856 | $0 | $0 |
Source: Public Records
Map
Nearby Homes
- 3496 Chaparrel Loop
- 3296 Nomie Way
- 3486 Chaparrel Loop
- 20349 Noble Ln
- 20322 Noble Ln
- 22987 Bland Cir
- 2762 Dahlia Dr
- 20111 Hoodview Ave
- 5135 Heron Dr
- 4057 Heron Dr
- 2025 De Vries Way
- 2037 De Vries Way
- 22872 Weatherhill Rd
- 3041 Winkel Way
- 2285 Satter St
- 3933 Parker Rd
- 2201 Satter St
- 23000 Bland Cir
- Allstone Plan at Savannah Summit
- Milton Plan at Savannah Summit
- 3545 Chelan Dr
- 3288 Wild Rose Loop
- 3537 Chelan Dr
- 3270 Dawson Ct
- 3282 Wild Rose Loop
- 21965 Chelan Loop
- 21945 Chelan Loop
- 21935 Chelan Loop
- 3268 Dawson Ct
- 21925 Chelan Loop
- 3535 Chelan Dr
- 3266 Dawson Ct
- 3529 Chelan Dr
- 3534 Chelan Dr
- 3264 Dawson Ct
- 21985 Chelan Loop Unit 37-D
- 21985 Chelan Loop
- 21975 Chelan Loop
- 3404 Chelan Dr
- 3528 Chelan Dr