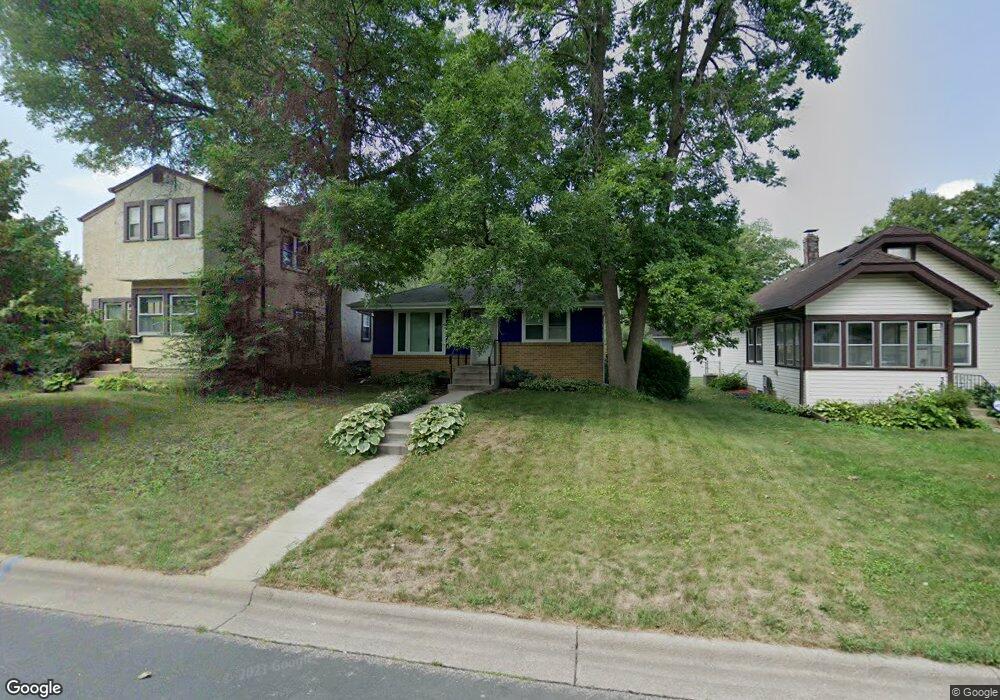
3549 Kyle Ave N Minneapolis, MN 55422
Estimated Value: $333,000 - $346,000
4
Beds
2
Baths
2,016
Sq Ft
$168/Sq Ft
Est. Value
About This Home
This home is located at 3549 Kyle Ave N, Minneapolis, MN 55422 and is currently estimated at $337,868, approximately $167 per square foot. 3549 Kyle Ave N is a home located in Hennepin County with nearby schools including Noble Elementary School, Plymouth Middle School, and Armstrong High School.
Ownership History
Date
Name
Owned For
Owner Type
Purchase Details
Closed on
Sep 29, 2020
Sold by
Bolanos Lee and Bolanos Kirsten
Bought by
Martin John and Martin Erica
Current Estimated Value
Home Financials for this Owner
Home Financials are based on the most recent Mortgage that was taken out on this home.
Original Mortgage
$276,935
Outstanding Balance
$150,774
Interest Rate
2.9%
Mortgage Type
Stand Alone Second
Estimated Equity
$187,094
Purchase Details
Closed on
Sep 6, 2018
Sold by
Ley Patrick Christopher and Ley Shari Anna Marie
Bought by
Bolanos Lee and Bolanos Kirsten
Home Financials for this Owner
Home Financials are based on the most recent Mortgage that was taken out on this home.
Original Mortgage
$216,015
Interest Rate
4.37%
Mortgage Type
FHA
Purchase Details
Closed on
Dec 28, 2001
Sold by
Koshiol Christopher and Koshiol Holly
Bought by
Ley Patrick and Ley Shari
Purchase Details
Closed on
May 2, 1999
Sold by
Hoffman Shawn J and Hoffman Ella
Bought by
Miller Holly Rae
Create a Home Valuation Report for This Property
The Home Valuation Report is an in-depth analysis detailing your home's value as well as a comparison with similar homes in the area
Home Values in the Area
Average Home Value in this Area
Purchase History
| Date | Buyer | Sale Price | Title Company |
|---|---|---|---|
| Martin John | $285,500 | Dca Title | |
| Bolanos Lee | $220,000 | Dca Title | |
| Ley Patrick | $151,900 | -- | |
| Miller Holly Rae | $107,900 | -- |
Source: Public Records
Mortgage History
| Date | Status | Borrower | Loan Amount |
|---|---|---|---|
| Open | Martin John | $276,935 | |
| Closed | Martin John | $276,935 | |
| Previous Owner | Bolanos Lee | $216,015 |
Source: Public Records
Tax History Compared to Growth
Tax History
| Year | Tax Paid | Tax Assessment Tax Assessment Total Assessment is a certain percentage of the fair market value that is determined by local assessors to be the total taxable value of land and additions on the property. | Land | Improvement |
|---|---|---|---|---|
| 2024 | $4,482 | $312,200 | $85,500 | $226,700 |
| 2023 | $4,235 | $314,400 | $85,500 | $228,900 |
| 2022 | $3,636 | $304,000 | $85,000 | $219,000 |
| 2021 | $2,936 | $266,000 | $81,000 | $185,000 |
| 2020 | $2,863 | $216,000 | $60,000 | $156,000 |
| 2019 | $2,613 | $207,000 | $60,000 | $147,000 |
| 2018 | $2,921 | $184,000 | $47,000 | $137,000 |
| 2017 | $2,850 | $165,000 | $45,000 | $120,000 |
| 2016 | $2,795 | $153,000 | $41,000 | $112,000 |
| 2015 | $2,571 | $141,000 | $33,000 | $108,000 |
| 2014 | -- | $134,000 | $39,000 | $95,000 |
Source: Public Records
Map
Nearby Homes
- 3653 Hubbard Ave N
- 3643 Hubbard Ave N
- 3919 36th Ave N
- 3917 36th Ave N
- 3634 Orchard Ave N
- 3807 Hubbard Ave N
- 3448 Grimes Ave N
- 3647 Orchard Ave N
- 3816 Orchard Ave N
- 3721 Quail Ave N
- 3964 Hubbard Ave N
- 3223 Halglo Place
- 3728 Regent Ave N
- 3957 Lake Curve Ave N
- 3755 Regent Ave N
- 3240 Ewing Ave N
- 3142 Grimes Ave N
- 4201 40th Ave N
- 3530 Beard Ave N
- 5225 35th Ave N
- 3545 Kyle Ave N
- 3553 Kyle Ave N
- 3557 Kyle Ave N
- 4421 36th Ave N
- 3535 Kyle Ave N
- 3540 Lee Ave N
- 4427 4427 36th-Avenue-n
- 4427 36th Ave N
- 3548 Kyle Ave N
- 3544 Kyle Ave N
- 3552 Kyle Ave N
- 3534 Lee Ave N
- 3527 Kyle Ave N
- 3556 Kyle Ave N
- 3542 Kyle Ave N
- 3534 Kyle Ave N
- 3523 Kyle Ave N
- 3528 Lee Ave N
- 3530 Kyle Ave N
- 3524 Lee Ave N