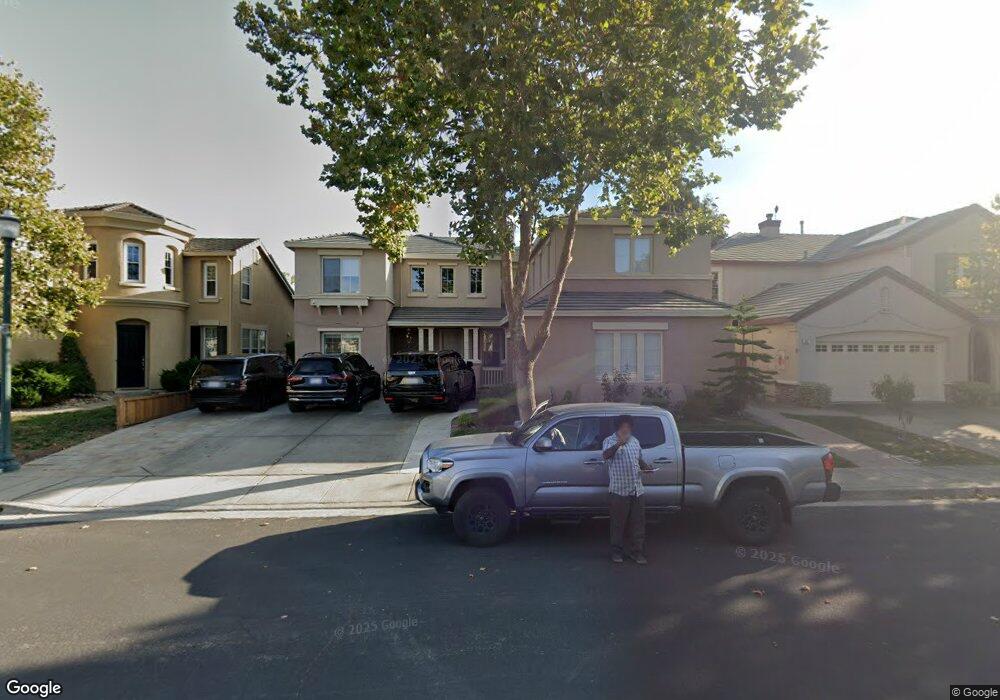
355 Ashbrook Way Hayward, CA 94544
Fairway Park NeighborhoodEstimated Value: $1,684,000 - $1,800,441
4
Beds
3
Baths
3,114
Sq Ft
$560/Sq Ft
Est. Value
About This Home
This home is located at 355 Ashbrook Way, Hayward, CA 94544 and is currently estimated at $1,742,610, approximately $559 per square foot. 355 Ashbrook Way is a home located in Alameda County with nearby schools including Treeview Elementary, Cesar Chavez Middle School, and Tennyson High School.
Ownership History
Date
Name
Owned For
Owner Type
Purchase Details
Closed on
Oct 17, 2023
Sold by
Singh Randeep and Kaur Rajvir
Bought by
Randeep Shergill Revocable Trust and Jaswinder Shergill Revocable Trust
Current Estimated Value
Purchase Details
Closed on
May 29, 2019
Sold by
Tanphanich Chaiwat and Tanphanich Jenice Carmen
Bought by
Singh Randeep and Kaur Rajvir
Purchase Details
Closed on
Aug 23, 2002
Sold by
Tanphanich Chaiwat and Tanphanich Jenice Carmen
Bought by
Tanphanich Chaiwat and Tanphanich Jenice Carmen
Purchase Details
Closed on
Jul 19, 1999
Sold by
Standard Pacific Corp
Bought by
Tanphanich Chaiwat and Tanphanich Janice Carmen
Home Financials for this Owner
Home Financials are based on the most recent Mortgage that was taken out on this home.
Original Mortgage
$373,700
Interest Rate
7.64%
Create a Home Valuation Report for This Property
The Home Valuation Report is an in-depth analysis detailing your home's value as well as a comparison with similar homes in the area
Home Values in the Area
Average Home Value in this Area
Purchase History
| Date | Buyer | Sale Price | Title Company |
|---|---|---|---|
| Randeep Shergill Revocable Trust | -- | None Listed On Document | |
| Singh Randeep | $1,250,000 | Old Republic Title Company | |
| Tanphanich Chaiwat | -- | New Century Title Company | |
| Tanphanich Chaiwat | $467,500 | First American Title Guarant |
Source: Public Records
Mortgage History
| Date | Status | Borrower | Loan Amount |
|---|---|---|---|
| Previous Owner | Tanphanich Chaiwat | $373,700 | |
| Closed | Tanphanich Chaiwat | $23,300 |
Source: Public Records
Tax History Compared to Growth
Tax History
| Year | Tax Paid | Tax Assessment Tax Assessment Total Assessment is a certain percentage of the fair market value that is determined by local assessors to be the total taxable value of land and additions on the property. | Land | Improvement |
|---|---|---|---|---|
| 2025 | $17,231 | $1,394,374 | $418,312 | $976,062 |
| 2024 | $17,231 | $1,367,037 | $410,111 | $956,926 |
| 2023 | $16,943 | $1,340,237 | $402,071 | $938,166 |
| 2022 | $16,610 | $1,313,961 | $394,188 | $919,773 |
| 2021 | $16,524 | $1,288,200 | $386,460 | $901,740 |
| 2020 | $16,345 | $1,275,000 | $382,500 | $892,500 |
| 2019 | $8,901 | $643,556 | $193,163 | $450,393 |
| 2018 | $8,351 | $630,939 | $189,376 | $441,563 |
| 2017 | $8,150 | $618,571 | $185,664 | $432,907 |
| 2016 | $7,719 | $606,444 | $182,024 | $424,420 |
| 2015 | $7,575 | $597,336 | $179,290 | $418,046 |
| 2014 | $7,278 | $585,635 | $175,778 | $409,857 |
Source: Public Records
Map
Nearby Homes
- 30487 Carroll Ave
- 30565 Prestwick Ave
- 30847 Prestwick Ave
- 250 Bridgewater Rd
- 30236 Vanderbilt St
- 581 Fairway St
- 649 Cherokee Ct
- 677 Fairway St
- 542 Caleb Place
- 31363 Meadowbrook Ave
- 29869 Vanderbilt St
- 29710 Hansen St
- 31338 Brae Burn Ave
- 260 Industrial Pkwy Unit 5
- 260 Industrial Pkwy Unit 47
- 100 Boardwalk Way
- 31518 Medinah St
- 29583 Vanderbilt St Unit 310
- 409 Line St
- 389 Line St
- 351 Ashbrook Way
- 359 Ashbrook Way
- 30504 Hoylake St
- 347 Ashbrook Way
- 363 Ashbrook Way
- 30496 Hoylake St
- 30512 Hoylake St
- 30287 Cedarbrook Rd
- 30488 Hoylake St
- 367 Ashbrook Way
- 30520 Hoylake St
- 343 Ashbrook Way
- 360 Ashbrook Way
- 30480 Hoylake St
- 30286 Oakbrook Rd
- 30281 Cedarbrook Rd
- 366 Ashbrook Way
- 30528 Hoylake St
- 371 Ashbrook Way
- 30472 Hoylake St