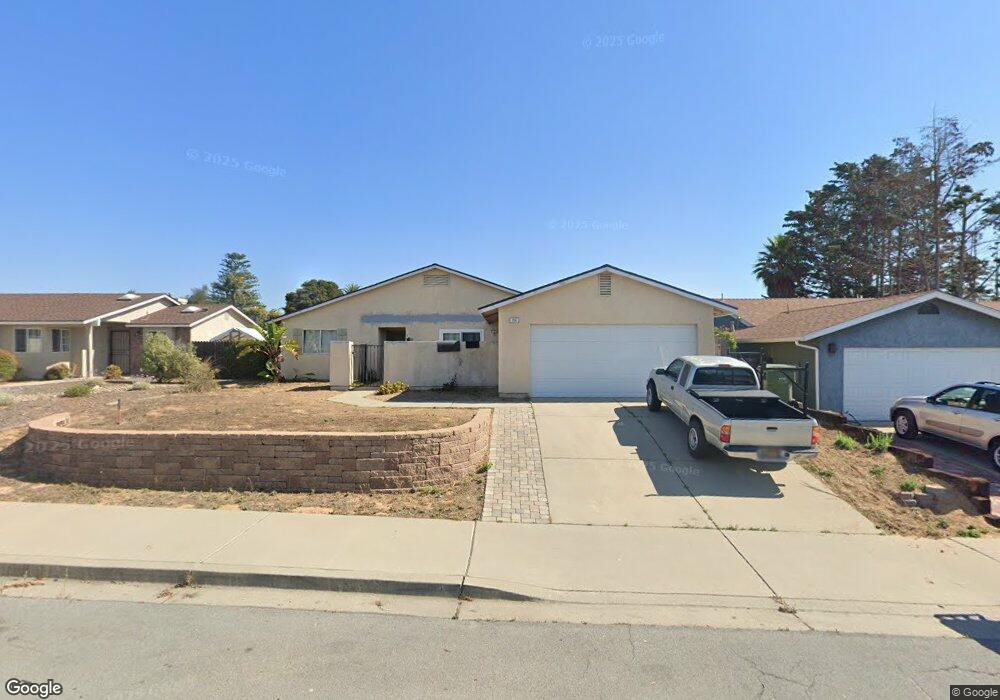
355 Black Hawk Way Nipomo, CA 93444
Estimated Value: $614,000 - $930,000
3
Beds
2
Baths
1,300
Sq Ft
$555/Sq Ft
Est. Value
About This Home
This home is located at 355 Black Hawk Way, Nipomo, CA 93444 and is currently estimated at $721,022, approximately $554 per square foot. 355 Black Hawk Way is a home located in San Luis Obispo County with nearby schools including Dana Elementary School, Mesa Middle School, and Nipomo High School.
Ownership History
Date
Name
Owned For
Owner Type
Purchase Details
Closed on
Feb 27, 2002
Sold by
Hernandez Aurelio M and Hernandez Rosa Ma
Bought by
Hernandez Aurelio M and Hernandez Rosa Maria
Current Estimated Value
Purchase Details
Closed on
Feb 12, 1998
Sold by
Thomas Richard J and Thomas Kwee Eng
Bought by
Mccann Damon
Home Financials for this Owner
Home Financials are based on the most recent Mortgage that was taken out on this home.
Original Mortgage
$132,771
Outstanding Balance
$23,483
Interest Rate
6.99%
Mortgage Type
FHA
Estimated Equity
$697,539
Purchase Details
Closed on
Apr 18, 1994
Sold by
Bonita Homes Inc
Bought by
Thomas Richard J and Thomas Kwee Eng
Home Financials for this Owner
Home Financials are based on the most recent Mortgage that was taken out on this home.
Original Mortgage
$100,000
Interest Rate
8.3%
Create a Home Valuation Report for This Property
The Home Valuation Report is an in-depth analysis detailing your home's value as well as a comparison with similar homes in the area
Home Values in the Area
Average Home Value in this Area
Purchase History
| Date | Buyer | Sale Price | Title Company |
|---|---|---|---|
| Hernandez Aurelio M | -- | -- | |
| Mccann Damon | $134,500 | Chicago Title Co | |
| Thomas Richard J | $130,000 | Cuesta Title Guaranty Compan |
Source: Public Records
Mortgage History
| Date | Status | Borrower | Loan Amount |
|---|---|---|---|
| Open | Mccann Damon | $132,771 | |
| Previous Owner | Thomas Richard J | $100,000 |
Source: Public Records
Tax History
| Year | Tax Paid | Tax Assessment Tax Assessment Total Assessment is a certain percentage of the fair market value that is determined by local assessors to be the total taxable value of land and additions on the property. | Land | Improvement |
|---|---|---|---|---|
| 2025 | $2,227 | $214,726 | $95,788 | $118,938 |
| 2024 | $2,201 | $210,516 | $93,910 | $116,606 |
| 2023 | $2,201 | $206,389 | $92,069 | $114,320 |
| 2022 | $2,168 | $202,343 | $90,264 | $112,079 |
| 2021 | $2,164 | $198,377 | $88,495 | $109,882 |
| 2020 | $2,140 | $196,344 | $87,588 | $108,756 |
| 2019 | $2,127 | $192,495 | $85,871 | $106,624 |
| 2018 | $2,102 | $188,722 | $84,188 | $104,534 |
| 2017 | $2,063 | $185,023 | $82,538 | $102,485 |
| 2016 | $1,947 | $181,396 | $80,920 | $100,476 |
| 2015 | $1,919 | $178,672 | $79,705 | $98,967 |
| 2014 | $1,848 | $175,173 | $78,144 | $97,029 |
Source: Public Records
Map
Nearby Homes
- 345 Black Hawk Way
- 325 Black Hawk Way
- 483 Violet Ave
- 522 Higos Way
- 689 Phoebe St
- 270 S Tejas Place
- 680 Hill St
- 719 W Tefft St
- 945 Jeanette Ln
- 450 Avenida de Socios Unit 5
- 525 Grande Ave Unit D
- 640 Honey Grove Ln
- 778 Primrose Ln
- 850 Primrose Ln
- 353 Uranus Ct
- 429 Saturn Ct
- 461 Saturn Ct
- 468 Neptune Dr
- 449 W Tefft St
- 449 W Tefft St Unit 23
- 365 Black Hawk Way
- 335 Black Hawk Way
- 375 Black Hawk Way
- 350 Black Hawk Way
- 360 Black Hawk Way
- 340 Black Hawk Way
- 385 Black Hawk Way
- 330 Black Hawk Way
- 315 Black Hawk Way
- 395 Black Hawk Way
- 320 Black Hawk Way
- 355 Kestrel Way
- 365 Kestrel Way
- 345 Kestrel Way
- 397 Nopal Way
- 335 Kestrel Way
- 313 Black Hawk Way
- 399 Nopal Way
- 325 Kestrel Way
Your Personal Tour Guide
Ask me questions while you tour the home.