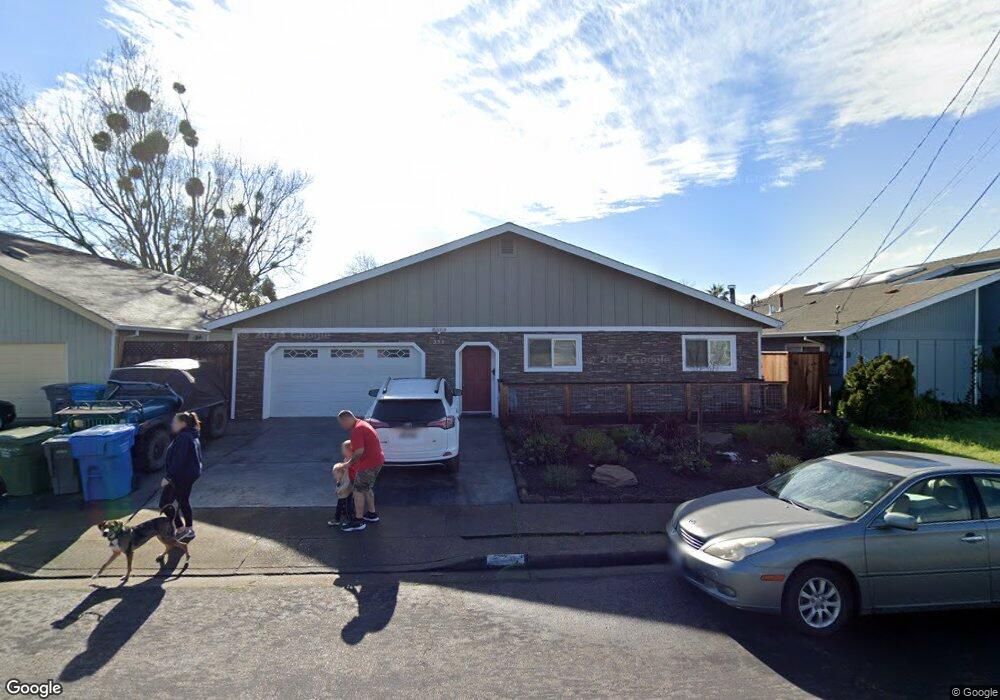
355 Bonnie Ave Rohnert Park, CA 94928
Estimated Value: $655,000 - $796,000
4
Beds
2
Baths
1,604
Sq Ft
$440/Sq Ft
Est. Value
About This Home
This home is located at 355 Bonnie Ave, Rohnert Park, CA 94928 and is currently estimated at $705,676, approximately $439 per square foot. 355 Bonnie Ave is a home located in Sonoma County with nearby schools including Rancho Cotate High School, Cross & Crown Lutheran School, and Bridghaven.
Ownership History
Date
Name
Owned For
Owner Type
Purchase Details
Closed on
Dec 18, 2014
Sold by
Shurtz Clint and Shurtz Nancy
Bought by
Shurtz Clint M and Shurtz Nancy
Current Estimated Value
Home Financials for this Owner
Home Financials are based on the most recent Mortgage that was taken out on this home.
Original Mortgage
$147,500
Outstanding Balance
$113,150
Interest Rate
3.96%
Mortgage Type
New Conventional
Estimated Equity
$592,526
Purchase Details
Closed on
Jun 27, 2003
Sold by
Nijjar Balbir Singh and Nijjar Raghbir Kaur
Bought by
Nijjar Balbir Singh and Nijjar Raghbir Kaur
Purchase Details
Closed on
Jan 14, 1995
Sold by
Hecker John F and Hecker Donna E
Bought by
Shurtz Clint and Shurtz Nancy
Home Financials for this Owner
Home Financials are based on the most recent Mortgage that was taken out on this home.
Original Mortgage
$148,500
Interest Rate
9.16%
Create a Home Valuation Report for This Property
The Home Valuation Report is an in-depth analysis detailing your home's value as well as a comparison with similar homes in the area
Home Values in the Area
Average Home Value in this Area
Purchase History
| Date | Buyer | Sale Price | Title Company |
|---|---|---|---|
| Shurtz Clint M | -- | Old Republic Title Company | |
| Nijjar Balbir Singh | -- | North Bay Title Co | |
| Shurtz Clint | $165,000 | First American Title |
Source: Public Records
Mortgage History
| Date | Status | Borrower | Loan Amount |
|---|---|---|---|
| Open | Shurtz Clint M | $147,500 | |
| Closed | Shurtz Clint | $148,500 |
Source: Public Records
Tax History Compared to Growth
Tax History
| Year | Tax Paid | Tax Assessment Tax Assessment Total Assessment is a certain percentage of the fair market value that is determined by local assessors to be the total taxable value of land and additions on the property. | Land | Improvement |
|---|---|---|---|---|
| 2025 | $3,126 | $274,488 | $133,086 | $141,402 |
| 2024 | $3,126 | $269,107 | $130,477 | $138,630 |
| 2023 | $3,126 | $263,831 | $127,919 | $135,912 |
| 2022 | $3,062 | $258,659 | $125,411 | $133,248 |
| 2021 | $3,035 | $253,588 | $122,952 | $130,636 |
| 2020 | $3,077 | $250,989 | $121,692 | $129,297 |
| 2019 | $3,036 | $246,068 | $119,306 | $126,762 |
| 2018 | $2,977 | $241,244 | $116,967 | $124,277 |
| 2017 | $2,926 | $236,515 | $114,674 | $121,841 |
| 2016 | $2,801 | $231,878 | $112,426 | $119,452 |
| 2015 | $2,732 | $228,396 | $110,738 | $117,658 |
| 2014 | $2,711 | $223,923 | $108,569 | $115,354 |
Source: Public Records
Map
Nearby Homes
- 359 Bonnie Ave
- 368 Bonnie Ct
- 8175 Arthur St
- 293 Lincoln Ave
- 8034 Adrian Dr
- 7449 Adrian Dr
- 461 Lincoln Ave
- 101 Pinewood Ct
- 8440 Lasalle Ave
- 219 College View Dr
- 8020 Beverly Dr
- 7530 Bernice Ave
- 11 Ramble Creek Dr
- 105 Nicholas Ct
- 121 Forno Way
- 218 W Cotati Ave
- 746 Bernadette Ave
- 152 Valparaiso Ave
- 8484 Lancaster Dr
- 220 Mendelssohn Ct