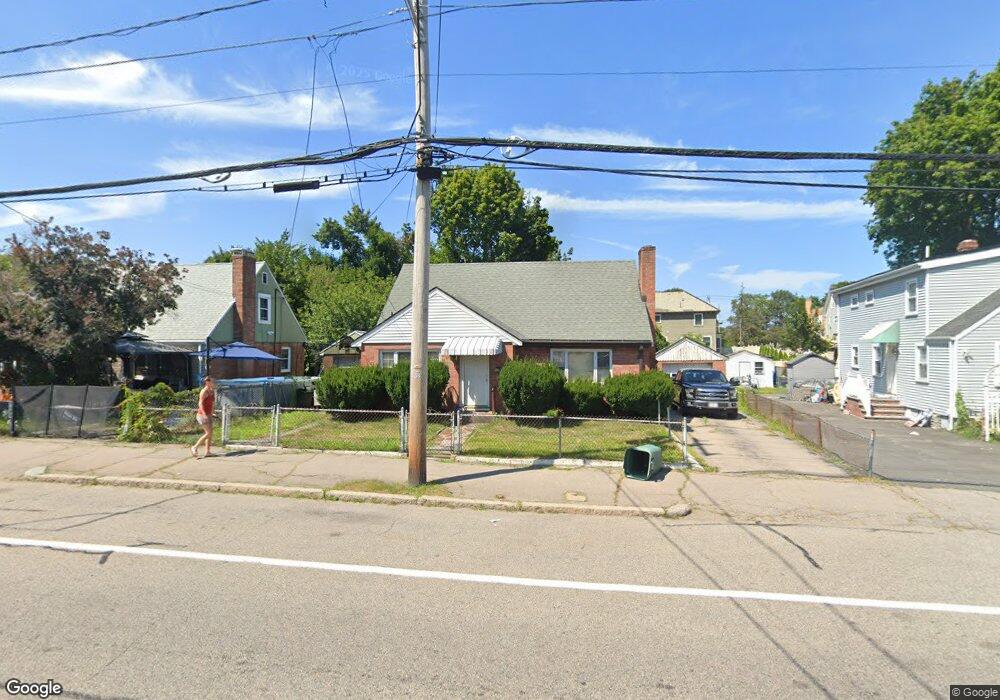
355 Copeland St Quincy, MA 02169
South Quincy NeighborhoodEstimated Value: $606,000 - $730,000
3
Beds
3
Baths
1,408
Sq Ft
$489/Sq Ft
Est. Value
About This Home
This home is located at 355 Copeland St, Quincy, MA 02169 and is currently estimated at $688,248, approximately $488 per square foot. 355 Copeland St is a home located in Norfolk County with nearby schools including South West Middle School, Lincoln-Hancock Community School, and Quincy High School.
Ownership History
Date
Name
Owned For
Owner Type
Purchase Details
Closed on
Apr 12, 2018
Sold by
Fnma
Bought by
Wells Fargo Bank Na
Current Estimated Value
Purchase Details
Closed on
Nov 1, 2011
Sold by
Farrell William J
Bought by
Federal National Mortgage Association
Purchase Details
Closed on
Oct 26, 1999
Sold by
Caron Tr Charles J
Bought by
Farrell William J and Farrell Traci D
Home Financials for this Owner
Home Financials are based on the most recent Mortgage that was taken out on this home.
Original Mortgage
$149,150
Interest Rate
7.83%
Mortgage Type
Purchase Money Mortgage
Purchase Details
Closed on
Jan 19, 1989
Sold by
Zamagni Richard M
Bought by
Caron Charles J
Create a Home Valuation Report for This Property
The Home Valuation Report is an in-depth analysis detailing your home's value as well as a comparison with similar homes in the area
Home Values in the Area
Average Home Value in this Area
Purchase History
| Date | Buyer | Sale Price | Title Company |
|---|---|---|---|
| Wells Fargo Bank Na | -- | -- | |
| Federal National Mortgage Association | $208,250 | -- | |
| Farrell William J | $157,000 | -- | |
| Caron Charles J | $150,000 | -- |
Source: Public Records
Mortgage History
| Date | Status | Borrower | Loan Amount |
|---|---|---|---|
| Previous Owner | Caron Charles J | $149,150 | |
| Previous Owner | Caron Charles J | $240,000 | |
| Previous Owner | Caron Charles J | $1,624,724 |
Source: Public Records
Tax History Compared to Growth
Tax History
| Year | Tax Paid | Tax Assessment Tax Assessment Total Assessment is a certain percentage of the fair market value that is determined by local assessors to be the total taxable value of land and additions on the property. | Land | Improvement |
|---|---|---|---|---|
| 2025 | $6,804 | $590,100 | $296,300 | $293,800 |
| 2024 | $6,463 | $573,500 | $282,200 | $291,300 |
| 2023 | $6,025 | $541,300 | $268,700 | $272,600 |
| 2022 | $5,731 | $478,400 | $215,000 | $263,400 |
| 2021 | $5,600 | $461,300 | $215,000 | $246,300 |
| 2020 | $5,592 | $449,900 | $215,000 | $234,900 |
| 2019 | $5,225 | $416,300 | $208,700 | $207,600 |
| 2018 | $5,243 | $393,000 | $193,200 | $199,800 |
| 2017 | $5,023 | $354,500 | $184,100 | $170,400 |
| 2016 | $4,690 | $326,600 | $167,300 | $159,300 |
| 2015 | $4,495 | $307,900 | $157,900 | $150,000 |
| 2014 | $4,241 | $285,400 | $157,900 | $127,500 |
Source: Public Records
Map
Nearby Homes
- 328 Copeland St Unit 3E
- 230 Willard St Unit 204
- 2 Ricciuti Dr Unit 8
- 41 Filbert St
- 211 Copeland St
- 28 Miller St Unit 8
- 145 Suomi Rd Unit C7
- 29 Oconnell Ave
- 73 Connell St
- 57A West St
- 47 Connell St
- 52 Bunker Hill Ln
- 9 Common St Unit 3
- 57 Buckley St
- 141 Gardiner Rd
- 111 Shawmut St
- 55 Station St Unit 1
- 211 West St Unit 12B
- 37 Wren Terrace Unit 2
- 72 Centre St Unit J
- 359 Copeland St
- 349 Copeland St
- 351 Copeland St
- 363 Copeland St
- 136 Crescent St
- 140 Crescent St
- 352 Copeland St
- 144 Crescent
- 142 Crescent St
- 128 Crescent St
- 128 Crescent St Unit 3
- 142 Hall Place
- 369 Copeland St
- 350 Copeland St
- 367 Copeland St Unit 2
- 136 Hall Place
- 335 Copeland St
- 152 Crescent St
- 122 Crescent St
- 116 Crescent St