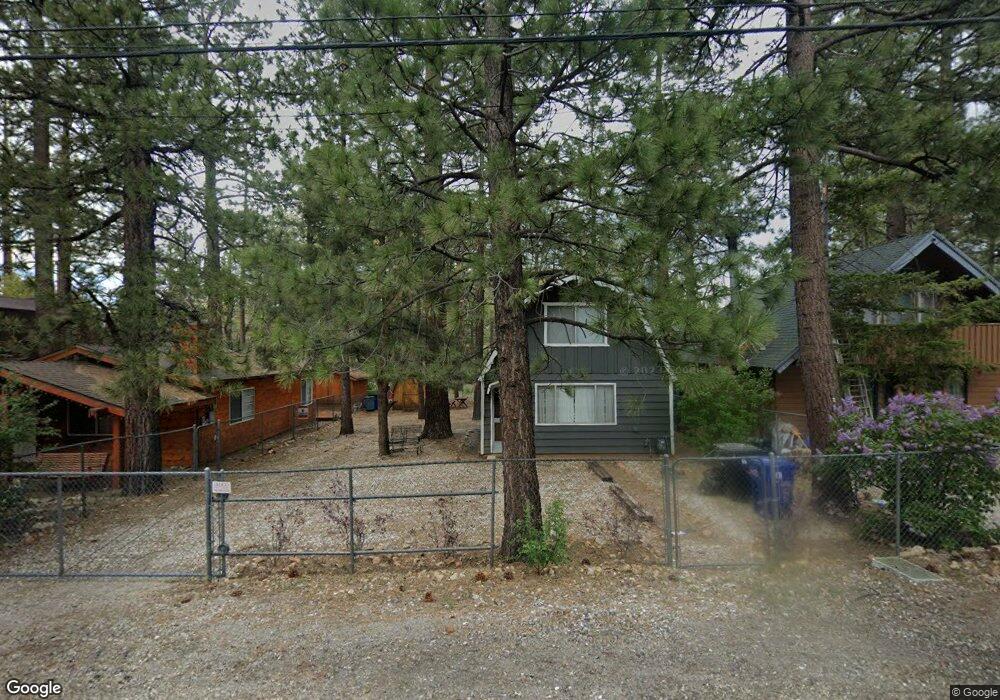
355 Holmes Ln Sugarloaf, CA 92386
Estimated Value: $159,000 - $286,000
1
Bed
1
Bath
787
Sq Ft
$304/Sq Ft
Est. Value
About This Home
This home is located at 355 Holmes Ln, Sugarloaf, CA 92386 and is currently estimated at $239,338, approximately $304 per square foot. 355 Holmes Ln is a home with nearby schools including Baldwin Lane Elementary School, Big Bear Middle School, and Big Bear High School.
Ownership History
Date
Name
Owned For
Owner Type
Purchase Details
Closed on
Apr 7, 2021
Sold by
Nieblas Thomas Dale and Nieblas Cynthia Diane
Bought by
Nieblas Thomas Dale and Nieblas Cynthia Diane
Current Estimated Value
Purchase Details
Closed on
Jun 14, 1995
Sold by
Coffin James A and Coffin William E
Bought by
Nieblas Thomas Dale and Nieblas Cytnhia Diane
Home Financials for this Owner
Home Financials are based on the most recent Mortgage that was taken out on this home.
Original Mortgage
$23,200
Interest Rate
7.5%
Mortgage Type
Purchase Money Mortgage
Create a Home Valuation Report for This Property
The Home Valuation Report is an in-depth analysis detailing your home's value as well as a comparison with similar homes in the area
Home Values in the Area
Average Home Value in this Area
Purchase History
| Date | Buyer | Sale Price | Title Company |
|---|---|---|---|
| Nieblas Thomas Dale | -- | None Available | |
| Nieblas Thomas Dale | $29,000 | Commonwealth Land Title Co |
Source: Public Records
Mortgage History
| Date | Status | Borrower | Loan Amount |
|---|---|---|---|
| Closed | Nieblas Thomas Dale | $23,200 |
Source: Public Records
Tax History Compared to Growth
Tax History
| Year | Tax Paid | Tax Assessment Tax Assessment Total Assessment is a certain percentage of the fair market value that is determined by local assessors to be the total taxable value of land and additions on the property. | Land | Improvement |
|---|---|---|---|---|
| 2025 | $1,774 | $48,175 | $16,610 | $31,565 |
| 2024 | $1,774 | $47,230 | $16,284 | $30,946 |
| 2023 | $1,688 | $46,304 | $15,965 | $30,339 |
| 2022 | $1,597 | $45,396 | $15,652 | $29,744 |
| 2021 | $1,550 | $44,506 | $15,345 | $29,161 |
| 2020 | $1,519 | $44,050 | $15,188 | $28,862 |
| 2019 | $1,486 | $43,186 | $14,890 | $28,296 |
| 2018 | $1,425 | $42,339 | $14,598 | $27,741 |
| 2017 | $1,378 | $41,509 | $14,312 | $27,197 |
| 2016 | $1,339 | $40,695 | $14,031 | $26,664 |
| 2015 | $1,307 | $40,083 | $13,820 | $26,263 |
| 2014 | $1,281 | $39,298 | $13,549 | $25,749 |
Source: Public Records
Map
Nearby Homes