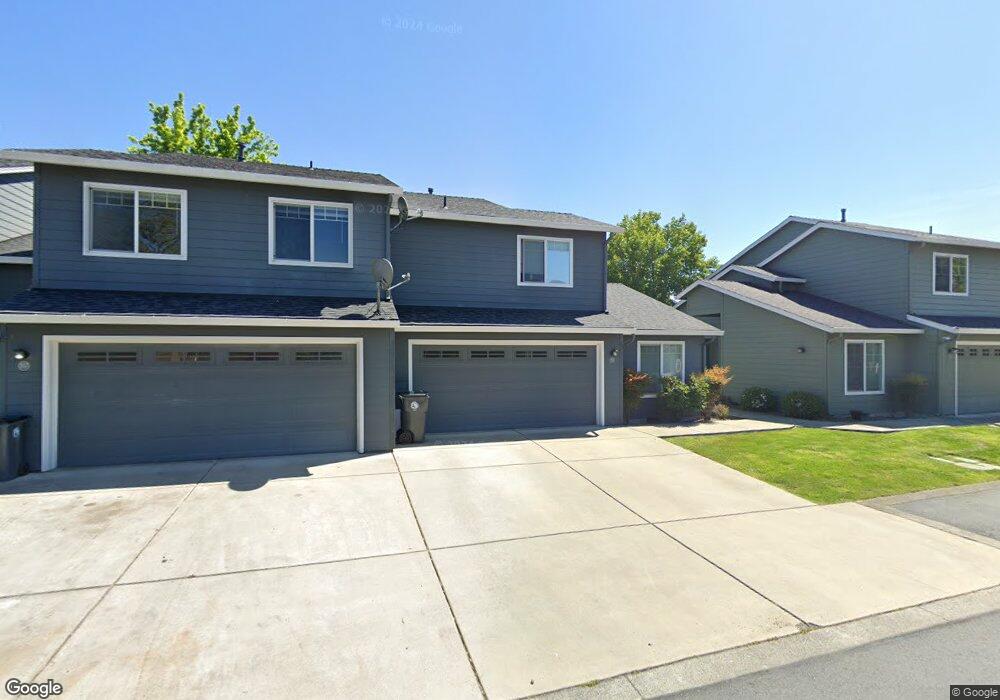
355 Live Oak Loop Unit 61 Central Point, OR 97502
Estimated Value: $267,000 - $333,000
2
Beds
3
Baths
1,322
Sq Ft
$236/Sq Ft
Est. Value
About This Home
This home is located at 355 Live Oak Loop Unit 61, Central Point, OR 97502 and is currently estimated at $311,753, approximately $235 per square foot. 355 Live Oak Loop Unit 61 is a home located in Jackson County with nearby schools including Jewett Elementary School, Scenic Middle School, and Crater High School.
Ownership History
Date
Name
Owned For
Owner Type
Purchase Details
Closed on
Aug 29, 2018
Sold by
Hurst Tracy A and Julie Lynne Hurst Trust
Bought by
Burtner Robbie Marie and Gilkey Barbara Sennett
Current Estimated Value
Home Financials for this Owner
Home Financials are based on the most recent Mortgage that was taken out on this home.
Original Mortgage
$211,105
Outstanding Balance
$183,693
Interest Rate
4.87%
Mortgage Type
FHA
Estimated Equity
$128,060
Purchase Details
Closed on
Aug 15, 2017
Sold by
Hurst Julie L
Bought by
Hurst Julie Lynne and The Julie Lynne Hurst Trust
Purchase Details
Closed on
Jun 12, 2014
Sold by
Beebe Wood Llc
Bought by
Hurst Julie L
Home Financials for this Owner
Home Financials are based on the most recent Mortgage that was taken out on this home.
Original Mortgage
$107,920
Interest Rate
4.25%
Mortgage Type
New Conventional
Create a Home Valuation Report for This Property
The Home Valuation Report is an in-depth analysis detailing your home's value as well as a comparison with similar homes in the area
Purchase History
| Date | Buyer | Sale Price | Title Company |
|---|---|---|---|
| Burtner Robbie Marie | $215,000 | First American Title | |
| Hurst Julie Lynne | -- | None Available | |
| Hurst Julie L | $134,900 | First American |
Source: Public Records
Mortgage History
| Date | Status | Borrower | Loan Amount |
|---|---|---|---|
| Open | Burtner Robbie Marie | $211,105 | |
| Previous Owner | Hurst Julie L | $107,920 |
Source: Public Records
Tax History
| Year | Tax Paid | Tax Assessment Tax Assessment Total Assessment is a certain percentage of the fair market value that is determined by local assessors to be the total taxable value of land and additions on the property. | Land | Improvement |
|---|---|---|---|---|
| 2026 | $3,249 | $179,780 | -- | -- |
| 2025 | $2,902 | $174,550 | $67,680 | $106,870 |
| 2024 | $2,902 | $169,470 | $65,710 | $103,760 |
| 2023 | $2,809 | $164,540 | $63,800 | $100,740 |
| 2022 | $2,743 | $164,540 | $63,800 | $100,740 |
| 2021 | $2,665 | $159,750 | $61,950 | $97,800 |
| 2020 | $2,587 | $155,100 | $60,150 | $94,950 |
| 2019 | $2,523 | $146,210 | $56,700 | $89,510 |
| 2018 | $2,447 | $141,960 | $55,050 | $86,910 |
| 2017 | $2,385 | $141,960 | $55,050 | $86,910 |
| 2016 | $2,316 | $133,820 | $51,890 | $81,930 |
| 2015 | $2,219 | $133,820 | $51,890 | $81,930 |
| 2014 | $2,162 | $126,150 | $48,910 | $77,240 |
Source: Public Records
Map
Nearby Homes
- 4286 Hamrick Rd
- 201 Orchardview Cir
- 446 Beebe Rd
- 1840 E Pine St
- 4601 Biddle Rd Unit C
- 4595 Table Rock Rd
- 4404 Biddle Rd
- 875 N Mountain Ave
- 4399 Table Rock Rd
- 4251 Table Rock Rd
- 4121 Table Rock Rd
- 1600 E Pine St
- 4105 Table Rock Rd
- 1109 Annalise St
- 1113 Annalise St
- 1121 Annalise St
- 4722 Gebhard Rd
- 4726 Gebhard Rd
- 230 Peninger Rd
- 1242 Hawk Dr
- 355 Live Oak Loop
- 357 Live Oak Loop Unit 60
- 357 Live Oak Loop
- 359 Live Oak Loop
- 2527 Mistletoe Ct Unit 58
- 2527 Mistletoe Ct
- 351 Live Oak Loop
- 343 Live Oak Loop
- 2531 Mistletoe Ct
- 341 Live Oak Loop Unit 74
- 341 Live Oak Loop
- 356 Live Oak Loop
- 358 Live Oak Loop Unit 67
- 358 Live Oak Loop
- 354 Live Oak Loop
- 363 Live Oak Loop
- 2535 Mistletoe Ct
- 360 Live Oak Loop Unit 66
- 360 Live Oak Loop
- 339 Live Oak Loop
Your Personal Tour Guide
Ask me questions while you tour the home.