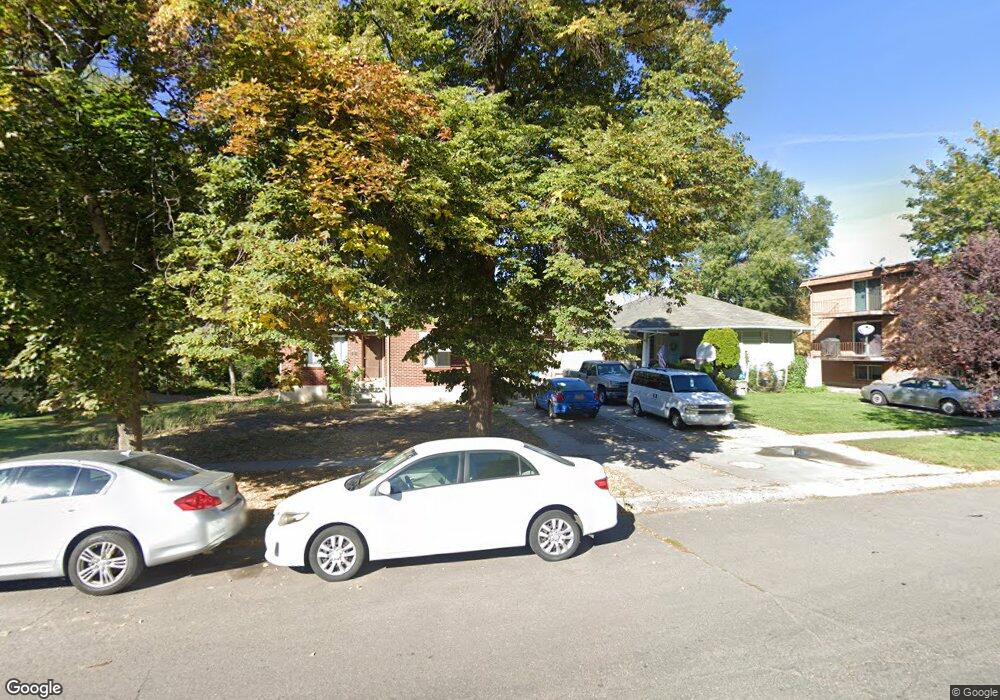
355 N 600 E Provo, UT 84606
Joaquin NeighborhoodEstimated Value: $529,000 - $579,142
3
Beds
2
Baths
1,280
Sq Ft
$437/Sq Ft
Est. Value
About This Home
This home is located at 355 N 600 E, Provo, UT 84606 and is currently estimated at $559,714, approximately $437 per square foot. 355 N 600 E is a home with nearby schools including Provo Peaks School, Centennial Middle School, and Timpview High School.
Ownership History
Date
Name
Owned For
Owner Type
Purchase Details
Closed on
Nov 28, 2017
Sold by
Relly Drrew and Johnson Dorothy
Bought by
Reilly Drew and Reilly Ashlyn
Current Estimated Value
Home Financials for this Owner
Home Financials are based on the most recent Mortgage that was taken out on this home.
Original Mortgage
$245,000
Outstanding Balance
$203,991
Interest Rate
3.88%
Mortgage Type
New Conventional
Estimated Equity
$355,723
Purchase Details
Closed on
Nov 20, 2013
Sold by
Wightman Norma Lewis
Bought by
Reilly Drew and Johnson Dorothy
Home Financials for this Owner
Home Financials are based on the most recent Mortgage that was taken out on this home.
Original Mortgage
$201,286
Interest Rate
3.87%
Mortgage Type
FHA
Purchase Details
Closed on
Feb 13, 2012
Sold by
Wightman Norma Lewis
Bought by
Wightman Norma Lewis
Create a Home Valuation Report for This Property
The Home Valuation Report is an in-depth analysis detailing your home's value as well as a comparison with similar homes in the area
Home Values in the Area
Average Home Value in this Area
Purchase History
| Date | Buyer | Sale Price | Title Company |
|---|---|---|---|
| Reilly Drew | -- | Vanguard Title Ins Agency | |
| Reilly Drew | -- | Liberty Title Co Llc | |
| Wightman Norma Lewis | -- | None Available |
Source: Public Records
Mortgage History
| Date | Status | Borrower | Loan Amount |
|---|---|---|---|
| Open | Reilly Drew | $245,000 | |
| Closed | Reilly Drew | $201,286 |
Source: Public Records
Tax History
| Year | Tax Paid | Tax Assessment Tax Assessment Total Assessment is a certain percentage of the fair market value that is determined by local assessors to be the total taxable value of land and additions on the property. | Land | Improvement |
|---|---|---|---|---|
| 2025 | $2,659 | $300,685 | -- | -- |
| 2024 | $2,659 | $261,690 | $0 | $0 |
| 2023 | $2,607 | $252,945 | $0 | $0 |
| 2022 | $2,889 | $282,700 | $0 | $0 |
| 2021 | $2,101 | $358,500 | $143,300 | $215,200 |
| 2020 | $2,037 | $325,900 | $130,300 | $195,600 |
| 2019 | $1,837 | $305,600 | $130,300 | $175,300 |
| 2018 | $1,700 | $286,800 | $123,000 | $163,800 |
| 2017 | $1,558 | $144,485 | $0 | $0 |
| 2016 | $1,382 | $119,405 | $0 | $0 |
| 2015 | $1,322 | $115,445 | $0 | $0 |
| 2014 | $1,196 | $108,900 | $0 | $0 |
Source: Public Records
Map
Nearby Homes
Your Personal Tour Guide
Ask me questions while you tour the home.