Estimated Value: $676,000 - $933,000
3
Beds
3
Baths
2,467
Sq Ft
$334/Sq Ft
Est. Value
About This Home
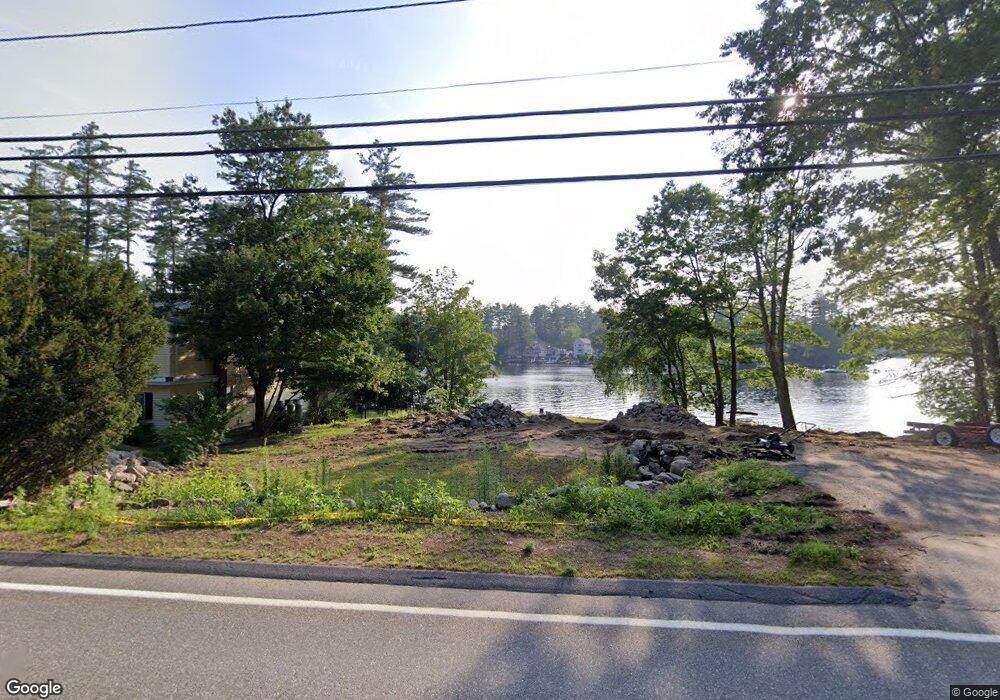
This home is located at 355 N Main St, Salem, NH 03079 and is currently estimated at $823,887, approximately $333 per square foot. 355 N Main St is a home located in Rockingham County with nearby schools including North Salem Elementary School, Woodbury School, and Salem High School.
Ownership History
Date
Name
Owned For
Owner Type
Purchase Details
Closed on
Oct 24, 2023
Sold by
Khoury Andre G and Khoury Stella P
Bought by
Khoury Ft and Khoury
Current Estimated Value
Home Financials for this Owner
Home Financials are based on the most recent Mortgage that was taken out on this home.
Original Mortgage
$725,000
Outstanding Balance
$711,912
Interest Rate
7.57%
Mortgage Type
Stand Alone Refi Refinance Of Original Loan
Estimated Equity
$111,975
Purchase Details
Closed on
Jun 17, 2022
Sold by
Stachulski Gary J
Bought by
Stachulski Ft and Stachulski
Home Financials for this Owner
Home Financials are based on the most recent Mortgage that was taken out on this home.
Original Mortgage
$300,000
Interest Rate
5.27%
Mortgage Type
Purchase Money Mortgage
Create a Home Valuation Report for This Property
The Home Valuation Report is an in-depth analysis detailing your home's value as well as a comparison with similar homes in the area
Purchase History
| Date | Buyer | Sale Price | Title Company |
|---|---|---|---|
| Khoury Ft | -- | None Available | |
| Khoury Ft | -- | None Available | |
| Stachulski Ft | $400,000 | None Available | |
| Stachulski Ft | $400,000 | None Available |
Source: Public Records
Mortgage History
| Date | Status | Borrower | Loan Amount |
|---|---|---|---|
| Open | Khoury Ft | $725,000 | |
| Previous Owner | Stachulski Ft | $300,000 |
Source: Public Records
Tax History
| Year | Tax Paid | Tax Assessment Tax Assessment Total Assessment is a certain percentage of the fair market value that is determined by local assessors to be the total taxable value of land and additions on the property. | Land | Improvement |
|---|---|---|---|---|
| 2024 | $11,451 | $650,600 | $373,100 | $277,500 |
| 2023 | $7,985 | $470,800 | $373,100 | $97,700 |
| 2022 | $7,556 | $470,800 | $373,100 | $97,700 |
| 2021 | $7,523 | $470,800 | $373,100 | $97,700 |
| 2020 | $7,584 | $344,400 | $266,400 | $78,000 |
| 2019 | $7,570 | $344,400 | $266,400 | $78,000 |
| 2018 | $7,248 | $344,400 | $266,400 | $78,000 |
| 2017 | $7,036 | $344,400 | $266,400 | $78,000 |
| 2016 | $7,036 | $344,400 | $266,400 | $78,000 |
| 2015 | $5,425 | $253,600 | $178,400 | $75,200 |
| 2014 | $5,272 | $253,600 | $178,400 | $75,200 |
| 2013 | $5,189 | $253,600 | $178,400 | $75,200 |
Source: Public Records
Map
Nearby Homes
- 26 Shore Dr
- 60 Shore Dr
- 15 King St
- 69 Caddy Dr
- 71 Caddy Dr
- 65 Caddy Dr
- 84 Caddy Dr
- 182 Shore Dr
- 16 Fox Run Ln Unit 10382
- 64 Trails Edge Rd
- 29 London Rd
- 55 Trails Edge Rd
- 27 London Rd
- 53 Trails Edge Rd
- 38 Gordon Mountain Rd
- 45 Trails Edge Rd
- 3 Evergreen Way Unit End unit
- 24 Rockingham Rd
- 114 Chases Grove Rd
- 10 Harris Rd
Your Personal Tour Guide
Ask me questions while you tour the home.