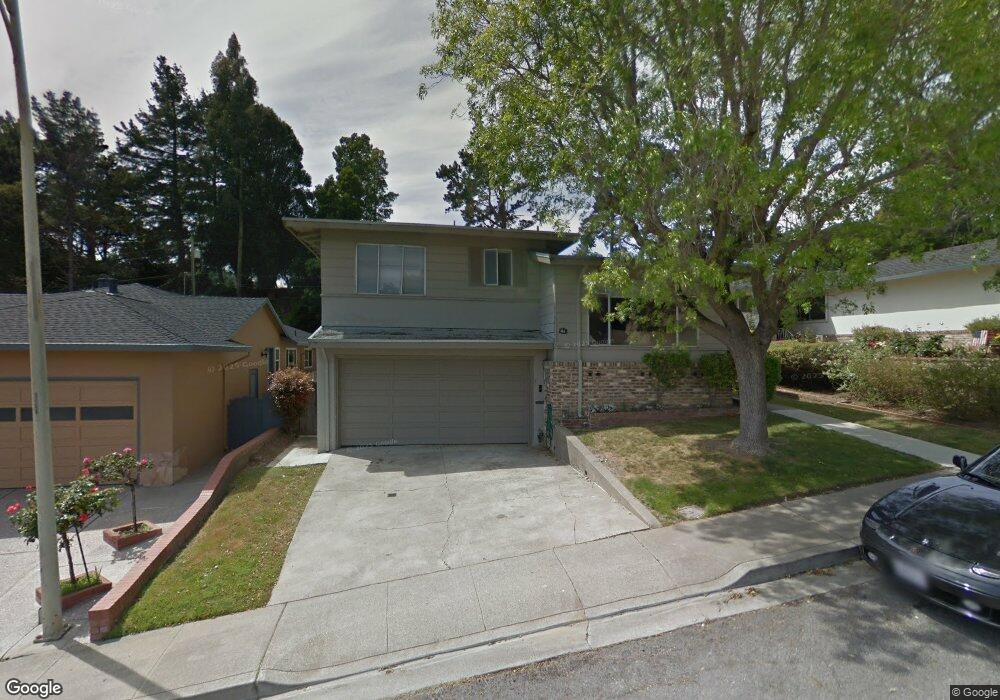
355 Palomar Ct San Bruno, CA 94066
Mills Park NeighborhoodEstimated Value: $1,462,000 - $1,631,000
3
Beds
2
Baths
1,520
Sq Ft
$1,017/Sq Ft
Est. Value
About This Home
This home is located at 355 Palomar Ct, San Bruno, CA 94066 and is currently estimated at $1,545,182, approximately $1,016 per square foot. 355 Palomar Ct is a home located in San Mateo County with nearby schools including John Muir Elementary School, Parkside Intermediate School, and Capuchino High School.
Ownership History
Date
Name
Owned For
Owner Type
Purchase Details
Closed on
Aug 4, 2024
Sold by
Fisher Mia Pennell
Bought by
Weiler Family Trust and Weiler
Current Estimated Value
Purchase Details
Closed on
Jun 12, 2024
Sold by
Richard M Weiler Trust and Adams Therese A
Bought by
Weiler Family Trust and Weiler
Purchase Details
Closed on
May 4, 2000
Sold by
Weiler William J and Weiler Evelyn A
Bought by
Weiler William Jack and Weiler Evelyn Anne
Purchase Details
Closed on
Dec 16, 1998
Sold by
Weiler William J and Weiler Evelyn A
Bought by
Weiler Wiliam J and Weiler Evelyn A
Home Financials for this Owner
Home Financials are based on the most recent Mortgage that was taken out on this home.
Original Mortgage
$148,000
Interest Rate
6.55%
Create a Home Valuation Report for This Property
The Home Valuation Report is an in-depth analysis detailing your home's value as well as a comparison with similar homes in the area
Home Values in the Area
Average Home Value in this Area
Purchase History
| Date | Buyer | Sale Price | Title Company |
|---|---|---|---|
| Weiler Family Trust | $165,000 | None Listed On Document | |
| Weiler Family Trust | -- | None Listed On Document | |
| Weiler William Jack | -- | -- | |
| Weiler Wiliam J | -- | North American Title Insuran |
Source: Public Records
Mortgage History
| Date | Status | Borrower | Loan Amount |
|---|---|---|---|
| Previous Owner | Weiler Wiliam J | $148,000 |
Source: Public Records
Tax History
| Year | Tax Paid | Tax Assessment Tax Assessment Total Assessment is a certain percentage of the fair market value that is determined by local assessors to be the total taxable value of land and additions on the property. | Land | Improvement |
|---|---|---|---|---|
| 2025 | $4,408 | $508,189 | $268,285 | $239,904 |
| 2023 | $4,408 | $317,951 | $123,070 | $194,881 |
| 2022 | $3,523 | $311,717 | $120,657 | $191,060 |
| 2021 | $3,477 | $305,606 | $118,292 | $187,314 |
| 2020 | $3,445 | $302,474 | $117,080 | $185,394 |
| 2019 | $3,390 | $296,544 | $114,785 | $181,759 |
| 2018 | $3,224 | $290,731 | $112,535 | $178,196 |
| 2017 | $3,190 | $285,031 | $110,329 | $174,702 |
| 2016 | $3,119 | $279,443 | $108,166 | $171,277 |
| 2015 | $3,078 | $275,247 | $106,542 | $168,705 |
| 2014 | $3,034 | $269,856 | $104,455 | $165,401 |
Source: Public Records
Map
Nearby Homes
- 353 Hazel Ave
- 468 Cedar Ave
- 411 Elm Ave
- 486 Hawthorne Ave
- 876 San Felipe Ave
- 183 Poplar Ave
- 498 Elm Ave
- 271 El Camino Real
- 507 Lomita Ave
- 116 San Felipe Ave
- 1449 Williams Ave
- 297 San Anselmo Ave N
- 293 Florida Ave
- 601 Linden Ave
- 413 Milton Ave
- 217 San Marco Ave Unit 219
- 5202 Shelter Creek Ln
- 4222 Shelter Creek Ln Unit 4222
- 2101 Shelter Creek Ln Unit 2101
- 2316 Shelter Creek Ln Unit 2316
- 365 Palomar Ct
- 345 Palomar Ct
- 375 Palomar Ct
- 335 Palomar Ct
- 383 Palomar Ct
- 325 Palomar Ct
- 315 Palomar Ct
- 360 Palomar Ct
- 350 Palomar Ct
- 385 Palomar Ct
- 370 Palomar Ct
- 340 Palomar Ct
- 380 Palomar Ct
- 330 Palomar Ct
- 386 Palomar Ct
- 1540 Donner Ave
- 320 Palomar Ct
- 393 Palomar Ct
- 1560 Donner Ave
- 305 Palomar Ct
Your Personal Tour Guide
Ask me questions while you tour the home.