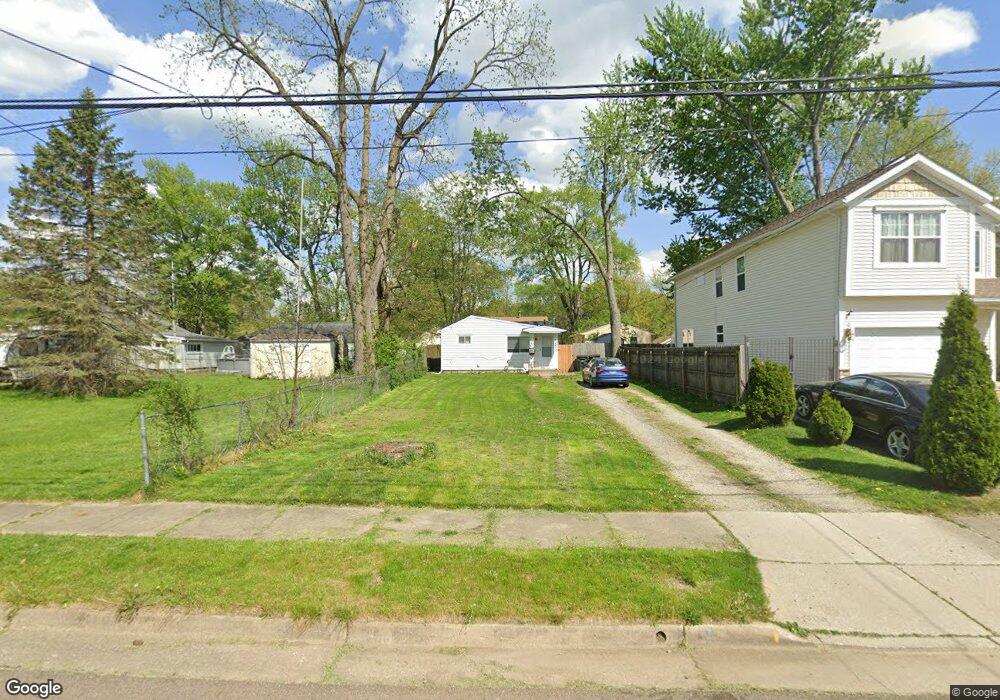
355 Ripley Ave Akron, OH 44312
Ellet NeighborhoodEstimated Value: $94,302 - $118,000
2
Beds
1
Bath
840
Sq Ft
$131/Sq Ft
Est. Value
About This Home
This home is located at 355 Ripley Ave, Akron, OH 44312 and is currently estimated at $109,826, approximately $130 per square foot. 355 Ripley Ave is a home located in Summit County with nearby schools including Ellet High School, Summit Academy Akron Elementary School, and Hatton Community Learning Center.
Ownership History
Date
Name
Owned For
Owner Type
Purchase Details
Closed on
Jan 3, 2022
Sold by
Hoskinson John E
Bought by
Sfr3-040 Llc
Current Estimated Value
Purchase Details
Closed on
Dec 1, 2021
Sold by
Hoskinson John E
Bought by
Sfr3 040 Llc
Purchase Details
Closed on
Sep 29, 2016
Sold by
Bower Herman G and Bower Norma J
Bought by
Hoskinson John E
Create a Home Valuation Report for This Property
The Home Valuation Report is an in-depth analysis detailing your home's value as well as a comparison with similar homes in the area
Home Values in the Area
Average Home Value in this Area
Purchase History
| Date | Buyer | Sale Price | Title Company |
|---|---|---|---|
| Sfr3-040 Llc | $23,000 | None Listed On Document | |
| Sfr3 040 Llc | $23,000 | None Available | |
| Hoskinson John E | $14,000 | Beacon Title Agency Inc |
Source: Public Records
Tax History Compared to Growth
Tax History
| Year | Tax Paid | Tax Assessment Tax Assessment Total Assessment is a certain percentage of the fair market value that is determined by local assessors to be the total taxable value of land and additions on the property. | Land | Improvement |
|---|---|---|---|---|
| 2025 | $1,937 | $31,189 | $7,361 | $23,828 |
| 2024 | $1,937 | $31,189 | $7,361 | $23,828 |
| 2023 | $1,937 | $31,189 | $7,361 | $23,828 |
| 2022 | $1,631 | $22,439 | $5,296 | $17,143 |
| 2021 | $1,577 | $22,439 | $5,296 | $17,143 |
| 2020 | $1,554 | $22,440 | $5,300 | $17,140 |
| 2019 | $1,264 | $16,380 | $5,800 | $10,580 |
| 2018 | $1,248 | $16,380 | $5,800 | $10,580 |
| 2017 | $1,267 | $16,380 | $5,800 | $10,580 |
| 2016 | $1,268 | $16,380 | $5,800 | $10,580 |
| 2015 | $1,267 | $16,380 | $5,800 | $10,580 |
| 2014 | $1,257 | $16,380 | $5,800 | $10,580 |
| 2013 | $1,326 | $17,700 | $5,800 | $11,900 |
Source: Public Records
Map
Nearby Homes
- 307 Pauline Ave
- 366 Dennison Ave
- 2948 Trenton Rd
- 379 Stull Ave
- 412 Stevenson Ave
- 490 Stevenson Ave
- 0 Kreiner Ave
- 440 Wirth Ave
- 256 High Grove Blvd
- 544 Dennison Ave
- 117 Kreiner Ave
- 423 Stetler Ave
- 47 Kreiner Ave
- 6 Kreiner Ave
- 5 Kreiner Ave
- 2863 Burnside St
- 2528 Ogden Ave
- 905 1/2 Shadybrook Dr
- 179 Davenport Ave
- V/L Marion Ave
- 359 Ripley Ave
- 363 Ripley Ave
- 343 Ripley Ave
- 2874 Trenton Rd
- 367 Ripley Ave
- 336 Pauline Ave
- 340 Pauline Ave
- 344 Pauline Ave
- 328 Pauline Ave
- 371 Ripley Ave
- 356 Ripley Ave
- 348 Ripley Ave
- 348 Pauline Ave
- 352 Ripley Ave
- 360 Ripley Ave
- 364 Ripley Ave
- 352 Pauline Ave
- 375 Ripley Ave
- 370 Ripley Ave
- 2873 Trenton Rd