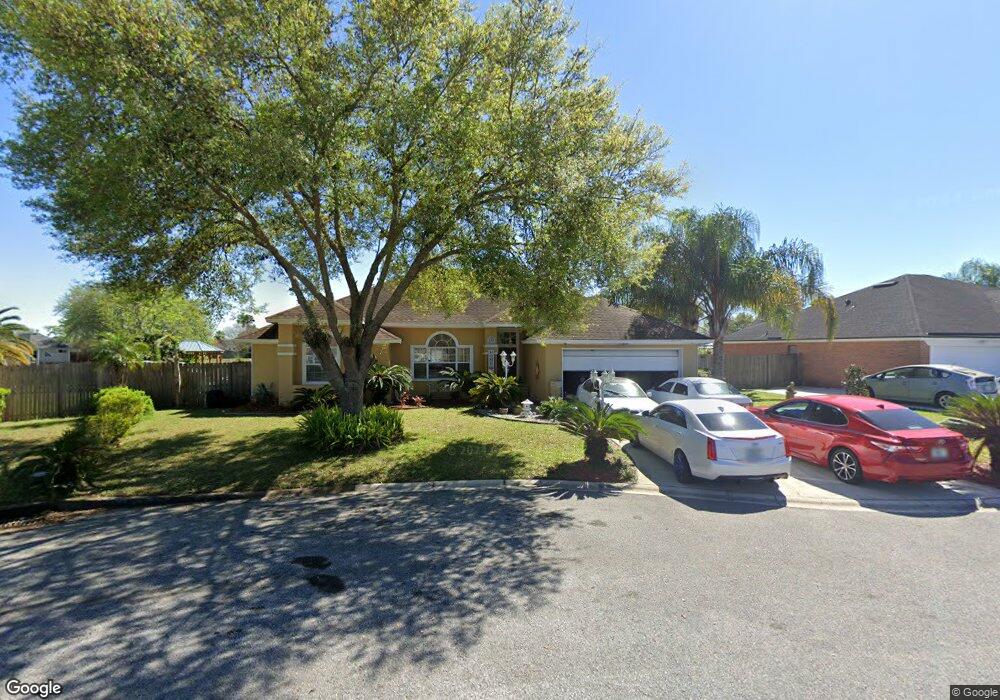
355 Sandy Bottom Ct Orange Park, FL 32073
Oakleaf NeighborhoodEstimated Value: $271,000 - $326,310
3
Beds
2
Baths
2,160
Sq Ft
$143/Sq Ft
Est. Value
About This Home
This home is located at 355 Sandy Bottom Ct, Orange Park, FL 32073 and is currently estimated at $308,828, approximately $142 per square foot. 355 Sandy Bottom Ct is a home located in Clay County with nearby schools including Argyle Elementary School, Orange Park High School, and Orange Park Junior High School.
Ownership History
Date
Name
Owned For
Owner Type
Purchase Details
Closed on
Jul 13, 2005
Sold by
Torres Eduardo and Torres Ada
Bought by
Torres Eduardo and Torres Ada
Current Estimated Value
Home Financials for this Owner
Home Financials are based on the most recent Mortgage that was taken out on this home.
Original Mortgage
$35,000
Outstanding Balance
$17,802
Interest Rate
5.46%
Mortgage Type
Credit Line Revolving
Estimated Equity
$291,026
Purchase Details
Closed on
Jul 1, 2004
Sold by
Thomas Vincent D and Jackson Patricia J
Bought by
Torres Eduardo and Torres Adal
Home Financials for this Owner
Home Financials are based on the most recent Mortgage that was taken out on this home.
Original Mortgage
$131,900
Outstanding Balance
$64,612
Interest Rate
6.25%
Mortgage Type
Purchase Money Mortgage
Estimated Equity
$244,216
Create a Home Valuation Report for This Property
The Home Valuation Report is an in-depth analysis detailing your home's value as well as a comparison with similar homes in the area
Home Values in the Area
Average Home Value in this Area
Purchase History
| Date | Buyer | Sale Price | Title Company |
|---|---|---|---|
| Torres Eduardo | -- | American Title Inc | |
| Torres Eduardo | $159,900 | -- |
Source: Public Records
Mortgage History
| Date | Status | Borrower | Loan Amount |
|---|---|---|---|
| Open | Torres Eduardo | $35,000 | |
| Open | Torres Eduardo | $131,900 |
Source: Public Records
Tax History
| Year | Tax Paid | Tax Assessment Tax Assessment Total Assessment is a certain percentage of the fair market value that is determined by local assessors to be the total taxable value of land and additions on the property. | Land | Improvement |
|---|---|---|---|---|
| 2025 | $1,491 | $142,923 | -- | -- |
| 2024 | $1,773 | $138,896 | -- | -- |
| 2023 | $1,773 | $134,851 | $0 | $0 |
| 2022 | $1,602 | $130,924 | $0 | $0 |
| 2021 | $1,595 | $127,111 | $0 | $0 |
| 2020 | $1,545 | $125,357 | $0 | $0 |
| 2019 | $1,519 | $122,539 | $0 | $0 |
| 2018 | $1,387 | $120,254 | $0 | $0 |
| 2017 | $1,376 | $117,781 | $0 | $0 |
| 2016 | $1,371 | $115,358 | $0 | $0 |
| 2015 | $1,412 | $114,556 | $0 | $0 |
| 2014 | $1,376 | $113,647 | $0 | $0 |
Source: Public Records
Map
Nearby Homes
- 343 Brier Rose Ln
- 364 Brier Rose Ln
- 3311 Deerfield Pointe Dr
- 3314 Deerfield Pointe Dr
- 3340 Deerfield Pointe Dr
- 3306 Deerfield Pointe Dr
- 3622 Double Branch Ln
- 2874 Pebblewood Ln
- 3528 Barrel Springs Dr
- 441 Northcliff Ct
- 3103 Fox Squirrel Dr
- 512 Hopewell Dr
- 546 Hopewell Dr
- 417 Oasis Ln Unit 3B
- 703 Bellshire Dr
- 350 Vineyard Ln
- 8499 Bandera Cir W
- 2759 Spencer Plantation Blvd
- 441 Sherwood Oaks Dr
- 9125 Camshire Dr
- 359 Sandy Bottom Ct
- 351 Sandy Bottom Ct
- 350 Sandy Bottom Ct
- 363 Sandy Bottom Ct
- 358 Sandy Bottom Ct
- 463 Federal Hill Rd
- 354 Sandy Bottom Ct
- 552 Jimbay Dr
- 453 Federal Hill Rd
- 467 Federal Hill Rd
- 548 Jimbay Dr
- 471 Federal Hill Rd
- 439 Federal Hill Rd
- 538 Jimbay Dr
- 443 Federal Hill Rd
- 462 Federal Hill Rd
- 534 Jimbay Dr
- 3276 Fox Squirrel Dr
- 435 Federal Hill Rd
- 458 Federal Hill Rd
Your Personal Tour Guide
Ask me questions while you tour the home.