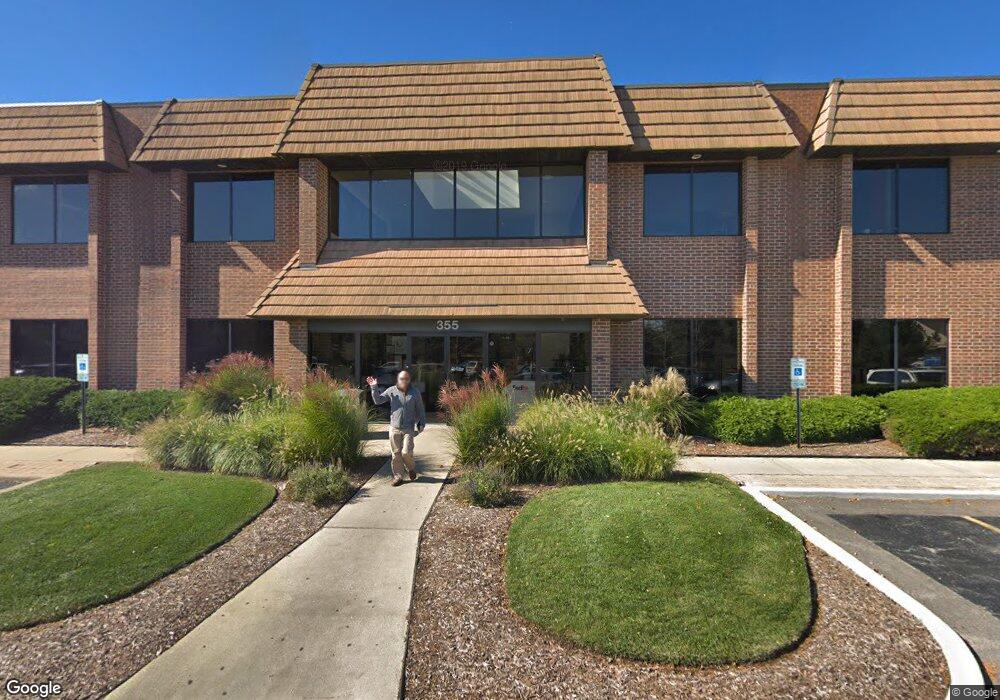
355 W Dundee Rd Unit 10 Buffalo Grove, IL 60089
South Buffalo Grove NeighborhoodEstimated Value: $394,895 - $456,000
2
Beds
--
Bath
68,000
Sq Ft
$6/Sq Ft
Est. Value
About This Home
This home is located at 355 W Dundee Rd Unit 10, Buffalo Grove, IL 60089 and is currently estimated at $417,724, approximately $6 per square foot. 355 W Dundee Rd Unit 10 is a home located in Cook County with nearby schools including J.W. Riley Elementary School, Jack London Middle School, and Buffalo Grove High School.
Ownership History
Date
Name
Owned For
Owner Type
Purchase Details
Closed on
Mar 25, 2025
Sold by
Cherevko Viktor and Cherevko Nadiya
Bought by
Cherevko Viktor
Current Estimated Value
Home Financials for this Owner
Home Financials are based on the most recent Mortgage that was taken out on this home.
Original Mortgage
$236,000
Outstanding Balance
$234,852
Interest Rate
7.13%
Mortgage Type
New Conventional
Estimated Equity
$182,872
Purchase Details
Closed on
Nov 23, 2022
Sold by
Jang Eun
Bought by
Cherevko Viktor
Home Financials for this Owner
Home Financials are based on the most recent Mortgage that was taken out on this home.
Original Mortgage
$247,500
Interest Rate
9.75%
Mortgage Type
New Conventional
Purchase Details
Closed on
Mar 5, 2004
Sold by
Rsd Shermer Building Two Llc
Bought by
Jang Eun
Home Financials for this Owner
Home Financials are based on the most recent Mortgage that was taken out on this home.
Original Mortgage
$230,970
Interest Rate
3.87%
Mortgage Type
Purchase Money Mortgage
Create a Home Valuation Report for This Property
The Home Valuation Report is an in-depth analysis detailing your home's value as well as a comparison with similar homes in the area
Home Values in the Area
Average Home Value in this Area
Purchase History
| Date | Buyer | Sale Price | Title Company |
|---|---|---|---|
| Cherevko Viktor | -- | None Listed On Document | |
| Cherevko Viktor | $330,000 | None Listed On Document | |
| Jang Eun | $289,000 | Cti |
Source: Public Records
Mortgage History
| Date | Status | Borrower | Loan Amount |
|---|---|---|---|
| Open | Cherevko Viktor | $236,000 | |
| Previous Owner | Cherevko Viktor | $247,500 | |
| Previous Owner | Jang Eun | $230,970 |
Source: Public Records
Tax History Compared to Growth
Tax History
| Year | Tax Paid | Tax Assessment Tax Assessment Total Assessment is a certain percentage of the fair market value that is determined by local assessors to be the total taxable value of land and additions on the property. | Land | Improvement |
|---|---|---|---|---|
| 2024 | $5,495 | $26,568 | $1,683 | $24,885 |
| 2023 | $5,322 | $26,568 | $1,683 | $24,885 |
| 2022 | $5,322 | $26,568 | $1,683 | $24,885 |
| 2021 | $3,550 | $17,000 | $807 | $16,193 |
| 2020 | $3,574 | $17,000 | $807 | $16,193 |
| 2019 | $3,436 | $18,685 | $807 | $17,878 |
| 2018 | $4,520 | $21,955 | $706 | $21,249 |
| 2017 | $4,442 | $21,955 | $706 | $21,249 |
| 2016 | $4,185 | $21,955 | $706 | $21,249 |
| 2015 | $3,790 | $18,451 | $572 | $17,879 |
| 2014 | $3,708 | $18,451 | $572 | $17,879 |
| 2013 | $3,647 | $18,451 | $572 | $17,879 |
Source: Public Records
Map
Nearby Homes
- 561 Park View Terrace Unit 153
- 3401 N Ellen Dr
- 3300 N Carriageway Dr Unit 317
- 3400 N Buffalo Grove Rd
- 665 Thornwood Dr
- 250 Old Oak Dr Unit 275
- 3157 N Daniels Ct Unit 1502
- 51 Old Oak Dr Unit 414
- 51 Old Oak Dr Unit 302
- 10 Old Oak Dr Unit 103
- 234 Mohawk Trail
- 820 Weidner Rd Unit 409
- 476 Raupp Blvd
- 455 Mayfair Ln
- 1306 E Best Dr
- 159 University Dr
- 813 Stradford Cir Unit 21B2
- 50 Lake Blvd Unit 632
- 50 Lake Blvd Unit 612
- 443 Diane Dr
- 355 W Dundee Rd Unit 10
- 355 W Dundee Rd Unit 105
- 374 Park View Terrace
- 374 Park View Terrace
- 372 Park View Terrace Unit 1-3
- 372 Park View Terrace
- 368 Park View Terrace
- 358 Park View Terrace
- 351 W Dundee Rd
- 360 Park View Terrace Unit 37
- 356 Park View Terrace Unit 356
- 352 Park View Terrace
- 350 Park View Terrace
- 350 Park View Terrace Unit 25
- 350 Park View Terrace Unit 12
- 350 Park View Terrace Unit 411
- 350 Park View Terrace Unit 410
- 350 Park View Terrace Unit 13
- 350 Park View Terrace Unit 38
- 350 Park View Terrace Unit 11