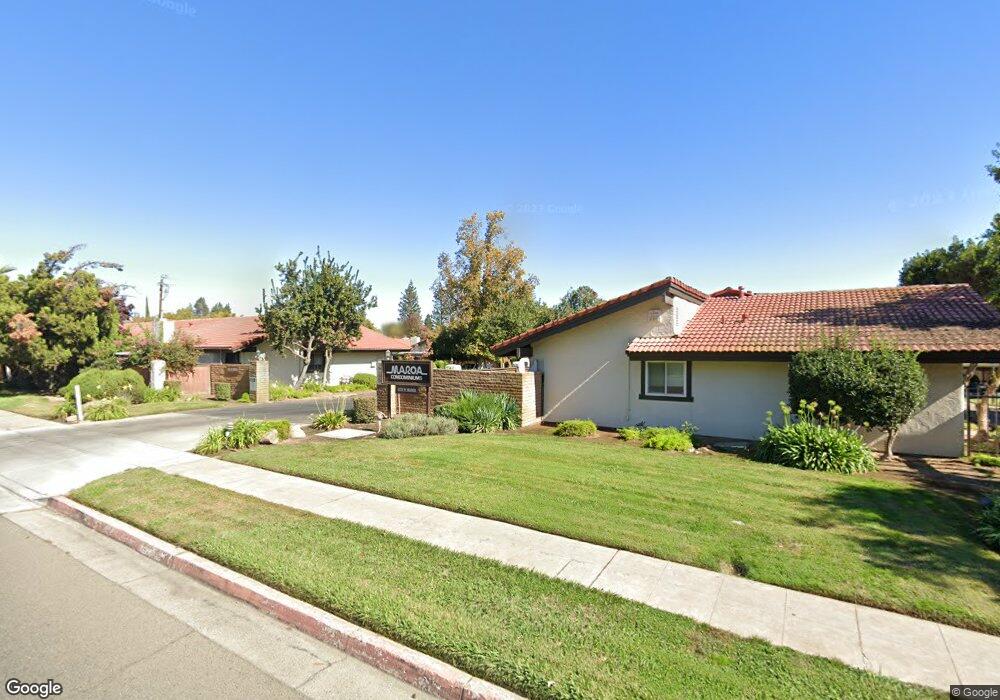
355 W Sierra Ave Unit 119 Fresno, CA 93704
Bullard NeighborhoodEstimated Value: $246,000 - $287,000
2
Beds
2
Baths
1,326
Sq Ft
$200/Sq Ft
Est. Value
About This Home
This home is located at 355 W Sierra Ave Unit 119, Fresno, CA 93704 and is currently estimated at $265,555, approximately $200 per square foot. 355 W Sierra Ave Unit 119 is a home located in Fresno County with nearby schools including Kratt Elementary School, Tenaya Middle School, and Bullard High School.
Ownership History
Date
Name
Owned For
Owner Type
Purchase Details
Closed on
Jan 24, 2017
Sold by
Eshraghi Ehsan and Eshraghi Foroogh
Bought by
Eshraghi Ehsan and Eshraghi Foroogh
Current Estimated Value
Purchase Details
Closed on
Nov 16, 2011
Sold by
The Bank Of New York Mellon
Bought by
Eshraghi Ehsan and Eshraghi Foroogh
Purchase Details
Closed on
Jul 1, 2011
Sold by
Hobab Hesam
Bought by
The Bank Of New York Mellon
Purchase Details
Closed on
Jun 29, 2005
Sold by
Rockwell Evalyn A and Renna Christina R
Bought by
Hobab Hesam
Home Financials for this Owner
Home Financials are based on the most recent Mortgage that was taken out on this home.
Original Mortgage
$198,550
Interest Rate
2%
Mortgage Type
Negative Amortization
Purchase Details
Closed on
Jun 21, 1995
Sold by
Emc Mtg Corp
Bought by
Rockwell Evalyn A and Renna Christina R
Purchase Details
Closed on
Jan 3, 1994
Sold by
Great Western Bank
Bought by
Emc Mtg Corp
Create a Home Valuation Report for This Property
The Home Valuation Report is an in-depth analysis detailing your home's value as well as a comparison with similar homes in the area
Home Values in the Area
Average Home Value in this Area
Purchase History
| Date | Buyer | Sale Price | Title Company |
|---|---|---|---|
| Eshraghi Ehsan | -- | None Available | |
| Eshraghi Ehsan | $72,500 | None Available | |
| The Bank Of New York Mellon | $73,125 | Landsafe Title | |
| Hobab Hesam | $209,000 | Fidelity National Title Co | |
| Rockwell Evalyn A | $52,000 | Chicago Title | |
| Emc Mtg Corp | $47,500 | Fidelity National Title |
Source: Public Records
Mortgage History
| Date | Status | Borrower | Loan Amount |
|---|---|---|---|
| Previous Owner | Hobab Hesam | $198,550 |
Source: Public Records
Tax History Compared to Growth
Tax History
| Year | Tax Paid | Tax Assessment Tax Assessment Total Assessment is a certain percentage of the fair market value that is determined by local assessors to be the total taxable value of land and additions on the property. | Land | Improvement |
|---|---|---|---|---|
| 2025 | $1,143 | $90,424 | $22,603 | $67,821 |
| 2023 | $1,122 | $86,915 | $21,726 | $65,189 |
| 2022 | $1,107 | $85,211 | $21,300 | $63,911 |
| 2021 | $1,077 | $83,541 | $20,883 | $62,658 |
| 2020 | $1,072 | $82,685 | $20,669 | $62,016 |
| 2019 | $1,031 | $81,064 | $20,264 | $60,800 |
| 2018 | $1,009 | $79,475 | $19,867 | $59,608 |
| 2017 | $992 | $77,918 | $19,478 | $58,440 |
| 2016 | $960 | $76,392 | $19,097 | $57,295 |
| 2015 | $946 | $75,246 | $18,811 | $56,435 |
| 2014 | $928 | $73,773 | $18,443 | $55,330 |
Source: Public Records
Map
Nearby Homes
- 355 W Sierra Ave Unit 106
- 6338 N Maroa Ave Unit 115
- 317 W Sierra Ave Unit 124
- 317 W Sierra Ave Unit 107
- 317 W Sierra Ave Unit 125
- 411 W Vartikian Ave
- 6316 N Poplar Ave
- 441 W Sample Ave
- 6284 N Del Mar Ave
- 6548 N Poplar Ave
- 365 W Escalon Ave
- 6607 N Maroa Ave
- 6164 N Maroa Ave
- 6265 N Colonial Ave
- 71 W Sierra Ave
- 6300 N Palm Ave Unit 125
- 6300 N Palm Ave Unit 105
- 60 W Sierra Ave Unit 102
- 64 W Sierra Ave Unit 103
- 353 W Warner Ave
- 355 W Sierra Ave
- 355 W Sierra Ave
- 355 W Sierra Ave Unit 105
- 355 W Sierra Ave Unit 104
- 355 W Sierra Ave Unit 103
- 355 W Sierra Ave Unit 101
- 355 W Sierra Ave Unit 102
- 355 W Sierra Ave Unit 111
- 355 W Sierra Ave Unit 110
- 355 W Sierra Ave Unit 109
- 355 W Sierra Ave Unit 112
- 355 W Sierra Ave Unit 113
- 355 W Sierra Ave Unit 114
- 355 W Sierra Ave Unit 115
- 355 W Sierra Ave Unit 124
- 355 W Sierra Ave Unit 123
- 355 W Sierra Ave Unit 122
- 355 W Sierra Ave Unit 121
- 355 W Sierra Ave Unit 120
- 355 W Sierra Ave Unit 118