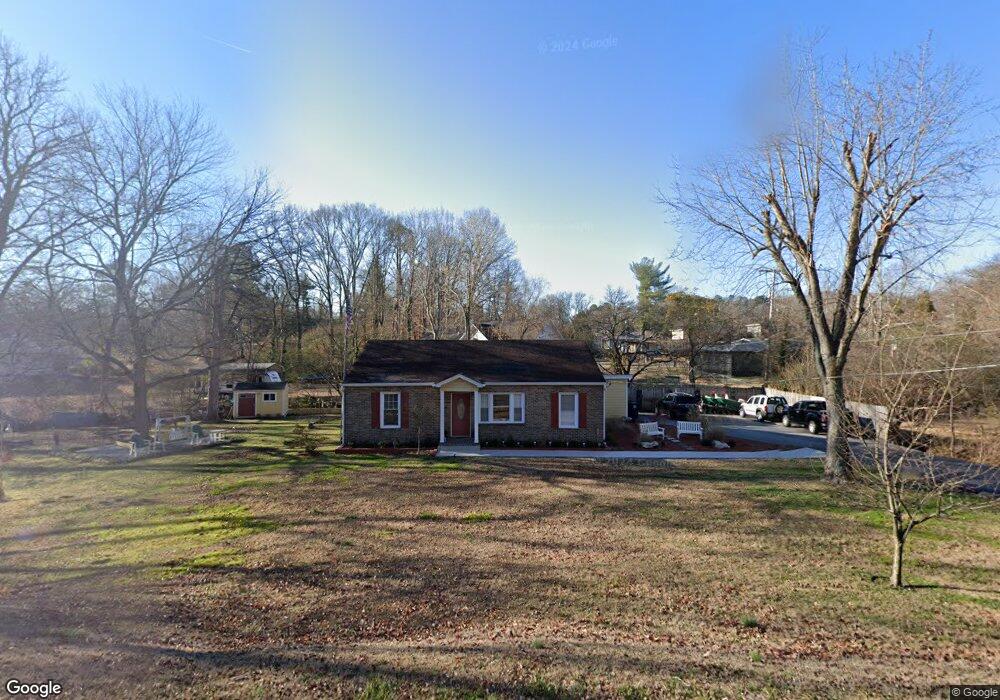
3550 Bennett Rd Chattanooga, TN 37412
Estimated Value: $274,000 - $321,000
4
Beds
2
Baths
1,704
Sq Ft
$173/Sq Ft
Est. Value
About This Home
This home is located at 3550 Bennett Rd, Chattanooga, TN 37412 and is currently estimated at $295,124, approximately $173 per square foot. 3550 Bennett Rd is a home located in Hamilton County with nearby schools including East Ridge Elementary School, East Ridge Middle School, and East Ridge High School.
Ownership History
Date
Name
Owned For
Owner Type
Purchase Details
Closed on
Jan 7, 2009
Sold by
Roberts Scott E
Bought by
Rhyne Steven B
Current Estimated Value
Home Financials for this Owner
Home Financials are based on the most recent Mortgage that was taken out on this home.
Original Mortgage
$141,127
Outstanding Balance
$91,657
Interest Rate
5.95%
Mortgage Type
FHA
Estimated Equity
$203,467
Purchase Details
Closed on
Jan 9, 2008
Sold by
Britt Linz Investments Llc
Bought by
Roberts Scott E
Purchase Details
Closed on
Jan 2, 2008
Sold by
Va
Bought by
Britt Linz Investments Llc
Purchase Details
Closed on
Sep 10, 2007
Sold by
Moore Clifford Lee
Bought by
Va
Purchase Details
Closed on
Mar 21, 1997
Sold by
Rich Jessy D and Rich Andrew Thomas
Bought by
Moore Clifford Lee
Home Financials for this Owner
Home Financials are based on the most recent Mortgage that was taken out on this home.
Original Mortgage
$69,010
Interest Rate
8%
Mortgage Type
VA
Create a Home Valuation Report for This Property
The Home Valuation Report is an in-depth analysis detailing your home's value as well as a comparison with similar homes in the area
Home Values in the Area
Average Home Value in this Area
Purchase History
| Date | Buyer | Sale Price | Title Company |
|---|---|---|---|
| Rhyne Steven B | $143,000 | First Title | |
| Roberts Scott E | -- | None Available | |
| Britt Linz Investments Llc | $50,000 | None Available | |
| Va | $52,878 | None Available | |
| Moore Clifford Lee | $67,000 | Northgate Title Escrow Inc |
Source: Public Records
Mortgage History
| Date | Status | Borrower | Loan Amount |
|---|---|---|---|
| Open | Rhyne Steven B | $141,127 | |
| Previous Owner | Moore Clifford Lee | $69,010 |
Source: Public Records
Tax History
| Year | Tax Paid | Tax Assessment Tax Assessment Total Assessment is a certain percentage of the fair market value that is determined by local assessors to be the total taxable value of land and additions on the property. | Land | Improvement |
|---|---|---|---|---|
| 2025 | $1,122 | $74,025 | $0 | $0 |
| 2024 | $851 | $38,050 | $0 | $0 |
| 2023 | $1,336 | $38,050 | $0 | $0 |
| 2022 | $1,336 | $38,050 | $0 | $0 |
| 2021 | $1,516 | $38,050 | $0 | $0 |
| 2020 | $1,380 | $29,025 | $0 | $0 |
| 2019 | $1,380 | $29,025 | $0 | $0 |
| 2018 | $1,380 | $29,025 | $0 | $0 |
| 2017 | $1,380 | $29,025 | $0 | $0 |
| 2016 | $1,346 | $0 | $0 | $0 |
| 2015 | $1,346 | $27,625 | $0 | $0 |
| 2014 | $1,346 | $0 | $0 | $0 |
Source: Public Records
Map
Nearby Homes
- 3614 Maiden Dr
- 3617 Helen Ln
- 3628 Helen Ln
- 3634 Helen Ln
- 3800 Kingwood Cir
- 1309 John Ross Rd
- 1119 Edwin Ln
- 112 Bales Ave
- 1159 Chippewah Dr
- 1402 John Ross Rd
- 1143 Chippewah Dr
- 3453 Bennett Rd
- 3609 Glen Oaks Dr
- 3919 Weldon Dr
- 3616 Wimberly Ln
- 1316 Orlando Ave
- 3414 Bennett Rd
- 3508 Mimbro Ln
- 4016 Wonder Dr
- 4 Edwards Terrace
- 3540 Bennett Rd
- 3619 Maiden Dr
- 3551 Bennett Rd
- 3615 Maiden Dr
- 3649 Bennett Rd
- 3553 Bennett Rd
- 3649 Bennett Rd
- 3538 Bennett Rd
- 3547 Bennett Rd
- 3633 Bennett Rd
- 3545 Bennett Rd
- 3613 Maiden Dr
- 3536 Bennett Rd Unit 2
- 3620 Maiden Dr
- 3702 Whitehead Ave
- 3629 Bennett Rd
- 3700 Whitehead Ave
- 3704 Whitehead Ave
- 3543 Bennett Rd
- 3616 Maiden Dr
Your Personal Tour Guide
Ask me questions while you tour the home.