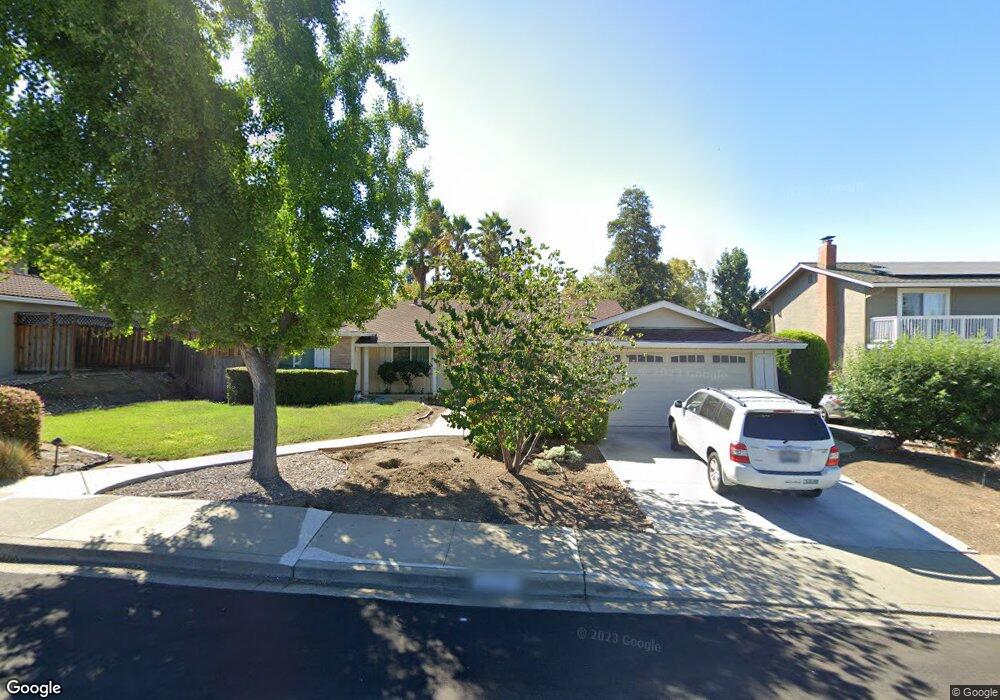
3551 Bayberry Dr Walnut Creek, CA 94598
Woodlands NeighborhoodEstimated Value: $1,475,000 - $1,689,000
4
Beds
3
Baths
2,147
Sq Ft
$715/Sq Ft
Est. Value
About This Home
This home is located at 3551 Bayberry Dr, Walnut Creek, CA 94598 and is currently estimated at $1,535,864, approximately $715 per square foot. 3551 Bayberry Dr is a home located in Contra Costa County with nearby schools including Valle Verde Elementary School, Foothill Middle School, and Northgate High School.
Ownership History
Date
Name
Owned For
Owner Type
Purchase Details
Closed on
Feb 19, 2019
Sold by
Kahawaiolaa Daniel F and Kahawaiolaa Kristen K
Bought by
Kahawaiolaa Daniel F and Kahawaiolaa Kristen K
Current Estimated Value
Purchase Details
Closed on
Jul 18, 2013
Sold by
Burch Steve M and Burch Jean B
Bought by
Kahawaiolaa Daniel F and Kahawaiolaa Kristen K
Home Financials for this Owner
Home Financials are based on the most recent Mortgage that was taken out on this home.
Original Mortgage
$417,000
Outstanding Balance
$302,707
Interest Rate
3.88%
Mortgage Type
New Conventional
Estimated Equity
$1,233,157
Purchase Details
Closed on
Mar 12, 2013
Sold by
Caine Esther Hazel
Bought by
Burch Steve M and Burch Jean B
Purchase Details
Closed on
Feb 13, 2006
Sold by
Caine Esther B
Bought by
The Esther Hazel Caine Living Trust
Create a Home Valuation Report for This Property
The Home Valuation Report is an in-depth analysis detailing your home's value as well as a comparison with similar homes in the area
Home Values in the Area
Average Home Value in this Area
Purchase History
| Date | Buyer | Sale Price | Title Company |
|---|---|---|---|
| Kahawaiolaa Daniel F | -- | None Available | |
| Kahawaiolaa Daniel F | $772,500 | Chicago Title Company | |
| Burch Steve M | -- | None Available | |
| The Esther Hazel Caine Living Trust | -- | None Available |
Source: Public Records
Mortgage History
| Date | Status | Borrower | Loan Amount |
|---|---|---|---|
| Open | Kahawaiolaa Daniel F | $417,000 |
Source: Public Records
Tax History Compared to Growth
Tax History
| Year | Tax Paid | Tax Assessment Tax Assessment Total Assessment is a certain percentage of the fair market value that is determined by local assessors to be the total taxable value of land and additions on the property. | Land | Improvement |
|---|---|---|---|---|
| 2025 | $11,066 | $952,886 | $785,649 | $167,237 |
| 2024 | $10,887 | $934,203 | $770,245 | $163,958 |
| 2023 | $10,887 | $915,887 | $755,143 | $160,744 |
| 2022 | $10,791 | $897,930 | $740,337 | $157,593 |
| 2021 | $10,552 | $880,324 | $725,821 | $154,503 |
| 2019 | $10,332 | $854,215 | $704,294 | $149,921 |
| 2018 | $9,960 | $837,467 | $690,485 | $146,982 |
| 2017 | $9,646 | $821,047 | $676,947 | $144,100 |
| 2016 | $9,366 | $799,949 | $663,674 | $136,275 |
| 2015 | $9,304 | $787,934 | $653,705 | $134,229 |
| 2014 | $9,185 | $772,500 | $640,900 | $131,600 |
Source: Public Records
Map
Nearby Homes
- 401 Seville Ln
- 206 Hamlin Loop
- 3067 Stinson Cir
- 3318 Ellesmere Ct
- 3055 Treat Blvd Unit 36
- 3051 Treat Blvd Unit 129
- 849 San Simeon Dr
- 822 Navaronne Way
- 2890 Treat Blvd Unit 5
- 4058 Treat Blvd
- 4495 Wildberry Ct
- 4362 Lynn Dr
- 788 Woodwind Place
- 2830 Royal Ann Ln
- 2840 Royal Ann Ln
- 1053 Arkell Rd
- 2745 Minert Rd
- 4317 Cowell Rd
- 1158 Saint Matthew Place Unit 107
- 817 Cheyenne Dr
- 3541 Bayberry Dr
- 3561 Bayberry Dr
- 3576 Tupelo Dr
- 3586 Tupelo Dr
- 3566 Tupelo Dr
- 3531 Bayberry Dr
- 3571 Bayberry Dr
- 3558 Bayberry Dr
- 3548 Bayberry Dr
- 3596 Tupelo Dr
- 3564 Bayberry Dr
- 3538 Bayberry Dr
- 3556 Tupelo Dr
- 3521 Bayberry Dr
- 3572 Bayberry Dr
- 3526 Bayberry Dr
- 3546 Tupelo Dr
- 3575 Tupelo Dr
- 3555 Cassena Dr
- 3545 Cassena Dr