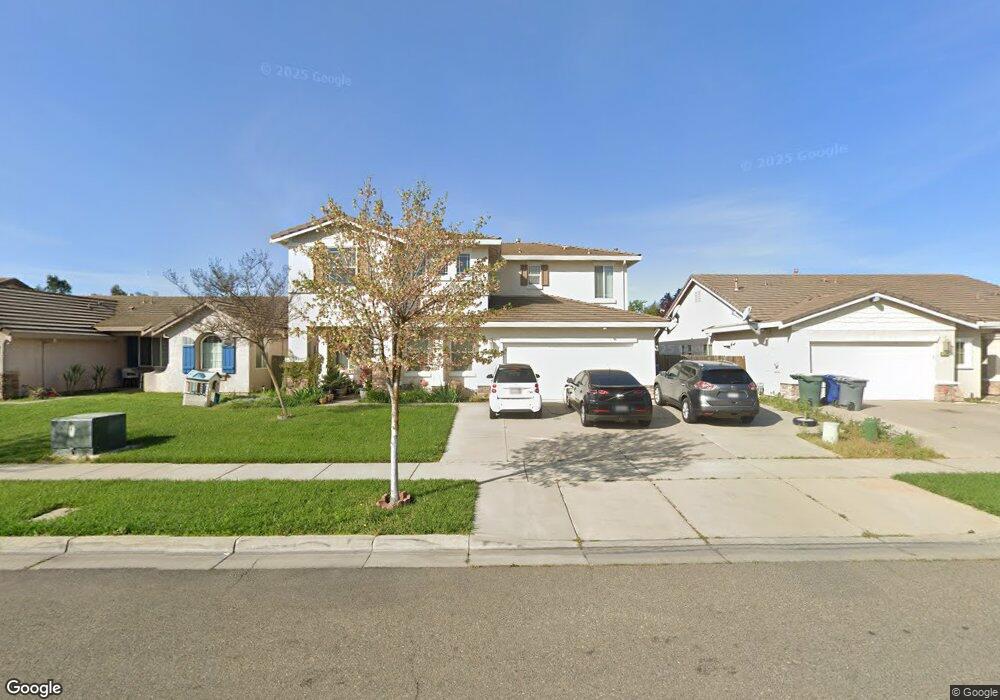
3551 San Vincent Ave Merced, CA 95348
Estimated Value: $454,579 - $545,000
4
Beds
3
Baths
2,374
Sq Ft
$210/Sq Ft
Est. Value
About This Home
This home is located at 3551 San Vincent Ave, Merced, CA 95348 and is currently estimated at $499,145, approximately $210 per square foot. 3551 San Vincent Ave is a home located in Merced County with nearby schools including Charles Wright Elementary School, Rudolph Rivera Middle School, and Merced High School.
Ownership History
Date
Name
Owned For
Owner Type
Purchase Details
Closed on
Feb 19, 2013
Sold by
Hong Lichan and Yu Lan
Bought by
Hong Lichan and Yu Lan
Current Estimated Value
Purchase Details
Closed on
Apr 5, 2010
Sold by
Yu Lan
Bought by
Hong Lichan
Purchase Details
Closed on
Mar 25, 2010
Sold by
Jpmorgan Chase Bank National Association
Bought by
Hong Lichan
Purchase Details
Closed on
Mar 1, 2010
Sold by
Lee Teng and Lor Kou
Bought by
Jpmorgan Chase Bank National Associaiton
Purchase Details
Closed on
Jun 30, 2004
Sold by
Fahrens Park
Bought by
Lee Teng and Lor Kou
Home Financials for this Owner
Home Financials are based on the most recent Mortgage that was taken out on this home.
Original Mortgage
$242,316
Interest Rate
5.87%
Mortgage Type
Purchase Money Mortgage
Create a Home Valuation Report for This Property
The Home Valuation Report is an in-depth analysis detailing your home's value as well as a comparison with similar homes in the area
Purchase History
| Date | Buyer | Sale Price | Title Company |
|---|---|---|---|
| Hong Lichan | -- | None Available | |
| Hong Lichan | -- | None Available | |
| Hong Lichan | -- | Fidelity National Title Comp | |
| Hong Lichan | $165,500 | Fidelity National Title Comp | |
| Jpmorgan Chase Bank National Associaiton | $144,400 | Accommodation | |
| Lee Teng | $303,000 | Transcounty Title Company |
Source: Public Records
Mortgage History
| Date | Status | Borrower | Loan Amount |
|---|---|---|---|
| Previous Owner | Lee Teng | $242,316 | |
| Closed | Lee Teng | $60,579 |
Source: Public Records
Tax History
| Year | Tax Paid | Tax Assessment Tax Assessment Total Assessment is a certain percentage of the fair market value that is determined by local assessors to be the total taxable value of land and additions on the property. | Land | Improvement |
|---|---|---|---|---|
| 2025 | $2,536 | $212,970 | $14,191 | $198,779 |
| 2024 | $2,536 | $208,795 | $13,913 | $194,882 |
| 2023 | $2,485 | $204,702 | $13,641 | $191,061 |
| 2022 | $2,455 | $200,689 | $13,374 | $187,315 |
| 2021 | $2,516 | $196,755 | $13,112 | $183,643 |
| 2020 | $2,955 | $194,738 | $12,978 | $181,760 |
| 2019 | $2,940 | $190,921 | $12,724 | $178,197 |
| 2018 | $2,758 | $187,178 | $12,475 | $174,703 |
| 2017 | $2,831 | $183,509 | $12,231 | $171,278 |
| 2016 | $2,879 | $179,912 | $11,992 | $167,920 |
| 2015 | $2,851 | $177,210 | $11,812 | $165,398 |
| 2014 | $2,803 | $173,740 | $11,581 | $162,159 |
Source: Public Records
Map
Nearby Homes
- 1338 Hermosa Dr
- 1840 Cheyenne Dr
- 1344 Paseo Redondo Dr
- 3622 N State Highway 59
- 3749 Morningside Ave
- 3742 Morningside Ave
- 1525 La Sierra St
- 1375 Loughborough Dr
- 3759 Larkspur Ave
- 3758 Larkspur Ave
- 3157 Juneau Ct
- 1277 Baxter Dr
- 1151 Mazatlan Place
- 1134 Puerto Vallarta Ct
- 1281 Sunup Dr
- 3500 Paseo Verde Ave
- 3482 Paseo Verde Ave
- 3546 Paseo Verde Ave
- 3880 Early Light Ave
- 1207 Day Light Dr
- 3547 San Vincent Ave
- 3555 San Vincent Ave
- 3544 San Moritz Ave
- 3548 San Moritz Ave
- 3543 San Vincent Ave
- 3559 San Vincent Ave
- 3540 San Moritz Ave
- 3552 San Moritz Ave
- 3536 San Moritz Ave
- 3548 San Vincent Ave
- 3563 San Vincent Ave
- 3539 San Vincent Ave
- 3544 San Vincent Ave
- 3558 San Vincent Ave
- 3556 San Moritz Ave
- 3540 San Vincent Ave
- 3532 San Moritz Ave
- 3564 San Vincent Ave
- 3567 San Vincent Ave
- 3533 San Vincent Ave
Your Personal Tour Guide
Ask me questions while you tour the home.