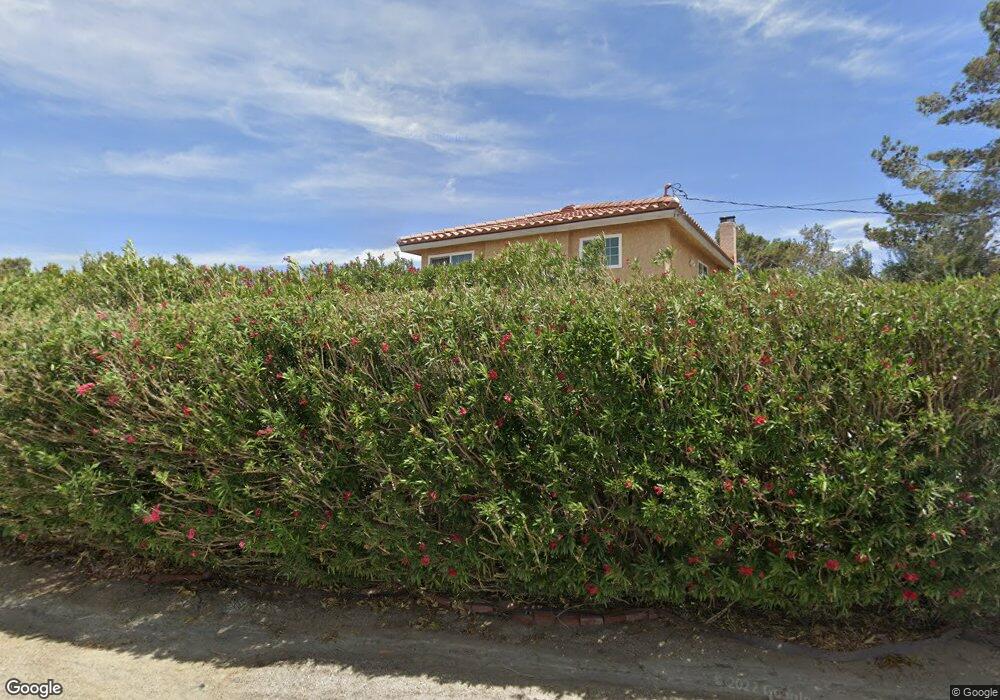
35510 Alida Ln Palmdale, CA 93552
Southeast Antelope Valley NeighborhoodEstimated Value: $608,000 - $760,000
3
Beds
3
Baths
2,428
Sq Ft
$273/Sq Ft
Est. Value
About This Home
This home is located at 35510 Alida Ln, Palmdale, CA 93552 and is currently estimated at $661,666, approximately $272 per square foot. 35510 Alida Ln is a home located in Los Angeles County with nearby schools including Alpine Elementary School, Keppel Academy, and Knight High School.
Ownership History
Date
Name
Owned For
Owner Type
Purchase Details
Closed on
Feb 27, 2003
Sold by
Bennett Anthony
Bought by
Bennett Denise M
Current Estimated Value
Home Financials for this Owner
Home Financials are based on the most recent Mortgage that was taken out on this home.
Original Mortgage
$236,800
Interest Rate
8.99%
Purchase Details
Closed on
Feb 5, 2003
Sold by
Wallace Brian J and Wallace Cynthia A
Bought by
Bennett Denise M
Home Financials for this Owner
Home Financials are based on the most recent Mortgage that was taken out on this home.
Original Mortgage
$236,800
Interest Rate
8.99%
Purchase Details
Closed on
Sep 16, 2002
Sold by
Wallace Cynthia A and Bookhart Cynthia A
Bought by
Wallace Brian J
Purchase Details
Closed on
Oct 20, 1995
Sold by
Bookhart Daniel W
Bought by
Bookhart Cynthia A
Purchase Details
Closed on
Aug 18, 1995
Sold by
Bookhart Cynthia A and Reid Cynthia A
Bought by
Bookhart Daniel W
Create a Home Valuation Report for This Property
The Home Valuation Report is an in-depth analysis detailing your home's value as well as a comparison with similar homes in the area
Home Values in the Area
Average Home Value in this Area
Purchase History
| Date | Buyer | Sale Price | Title Company |
|---|---|---|---|
| Bennett Denise M | -- | Chicago Title Co | |
| Bennett Denise M | $296,000 | Chicago Title Co | |
| Wallace Brian J | -- | -- | |
| Bookhart Cynthia A | -- | -- | |
| Bookhart Daniel W | -- | -- |
Source: Public Records
Mortgage History
| Date | Status | Borrower | Loan Amount |
|---|---|---|---|
| Previous Owner | Bennett Denise M | $236,800 |
Source: Public Records
Tax History
| Year | Tax Paid | Tax Assessment Tax Assessment Total Assessment is a certain percentage of the fair market value that is determined by local assessors to be the total taxable value of land and additions on the property. | Land | Improvement |
|---|---|---|---|---|
| 2025 | $4,983 | $428,683 | $106,005 | $322,678 |
| 2024 | $4,983 | $420,278 | $103,927 | $316,351 |
| 2023 | $4,909 | $412,039 | $101,890 | $310,149 |
| 2022 | $4,743 | $403,961 | $99,893 | $304,068 |
| 2021 | $4,684 | $396,041 | $97,935 | $298,106 |
| 2019 | $4,502 | $384,296 | $95,031 | $289,265 |
| 2018 | $11,224 | $376,762 | $93,168 | $283,594 |
| 2016 | $3,745 | $320,500 | $79,300 | $241,200 |
| 2015 | $3,760 | $320,500 | $79,300 | $241,200 |
| 2014 | $2,853 | $234,500 | $58,000 | $176,500 |
Source: Public Records
Map
Nearby Homes
- 35433 Alida Ln
- 0 Alida Ln
- 35815 42nd St E
- 0 E Avenue T 8
- 50 E 50th St Unit Ste Vic
- 0 Vic Avenue T12 Vic 52nd Ste Unit 25007973
- 5040 E Avenue t8
- 35401 Cheseboro Rd
- 3746 E Avenue t8
- 0 47th St E Unit V7 25002798
- 36324 43rd St E
- 3848 E Avenue t4
- 5204 E Avenue t4
- 0 E Ave V-2 Unit 25007663
- 0 Vac Ave V2 Vic 45th St E Unit 25006341
- 36403 Chalone Dr
- 4832 Summerbreeze Ct
- 0 42nd Ste Vic Avenue S12 Ste Unit 26000361
- 0 E Avenue V
- 0 E Ave T8 Vic Valley Spri Unit 25007838
- 35424 Alida Ln
- 35509 Alida Ln
- 35535 Alida Ln
- 35410 Alida Ln
- 4538 Palmdale Hills Dr
- 4414 Palmdale Hills Dr
- 4350 Palmdale Hills Dr
- 0 Cor Palmdale Unit 16003362
- 4342 Palmdale Hills Dr
- 4528 Palmdale Hills Dr
- 4318 Palmdale Hills Dr
- 0 Vac Aquaduct Vic 47th Ste
- 4567 Palmdale Hills Dr
- 4310 Palmdale Hills Dr
- 4558 Palmdale Hills Dr
- 4249 Palmdale Hills Dr
- 0 E 42nd St & Palmdale Hills Dr
- 4270 Palmdale Hills Dr
- 4566 Palmdale Hills Dr
- 4229 Palmdale Hills Dr
Your Personal Tour Guide
Ask me questions while you tour the home.