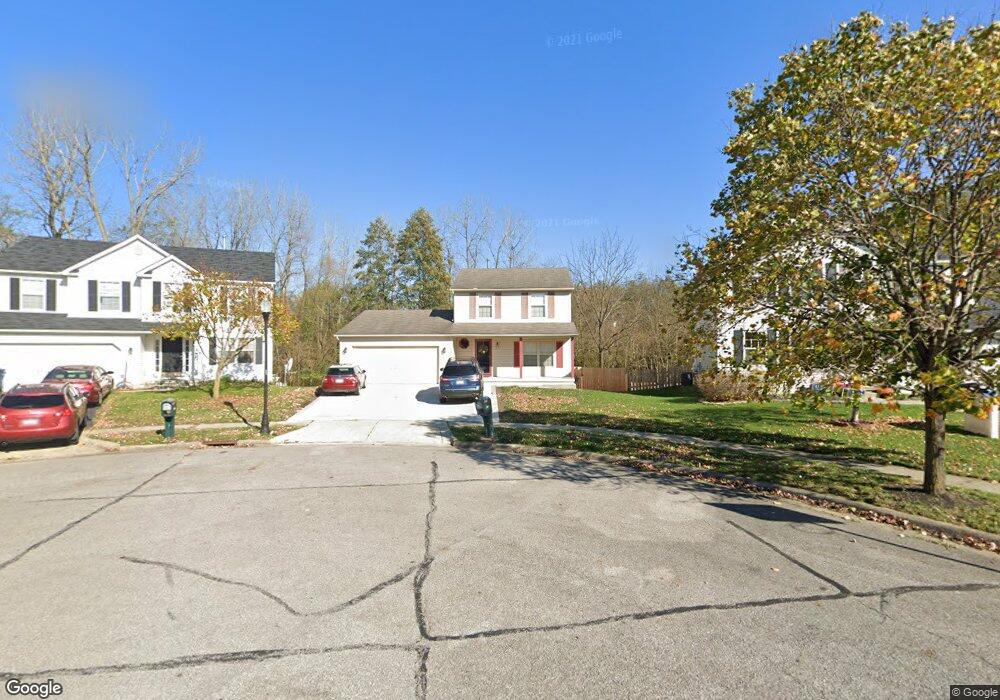
3552 Blendon Bend Way Columbus, OH 43231
Parkview NeighborhoodEstimated Value: $331,621 - $381,000
3
Beds
2
Baths
1,570
Sq Ft
$226/Sq Ft
Est. Value
About This Home
This home is located at 3552 Blendon Bend Way, Columbus, OH 43231 and is currently estimated at $354,405, approximately $225 per square foot. 3552 Blendon Bend Way is a home located in Franklin County with nearby schools including Hawthorne Elementary School, Heritage Middle School, and Westerville South High School.
Ownership History
Date
Name
Owned For
Owner Type
Purchase Details
Closed on
Aug 20, 2021
Sold by
Charles Edzer
Bought by
Charles Edzer and Charles Candice N
Current Estimated Value
Home Financials for this Owner
Home Financials are based on the most recent Mortgage that was taken out on this home.
Original Mortgage
$125,000
Outstanding Balance
$113,492
Interest Rate
2.8%
Mortgage Type
New Conventional
Estimated Equity
$240,913
Purchase Details
Closed on
Oct 29, 2004
Sold by
The Fritsche Corp
Bought by
Charles Edzer
Home Financials for this Owner
Home Financials are based on the most recent Mortgage that was taken out on this home.
Original Mortgage
$131,750
Interest Rate
5.85%
Mortgage Type
Purchase Money Mortgage
Purchase Details
Closed on
Dec 19, 2003
Sold by
Global Trading & Technology Inc
Bought by
The Fritsche Corp
Create a Home Valuation Report for This Property
The Home Valuation Report is an in-depth analysis detailing your home's value as well as a comparison with similar homes in the area
Home Values in the Area
Average Home Value in this Area
Purchase History
| Date | Buyer | Sale Price | Title Company |
|---|---|---|---|
| Charles Edzer | -- | Servicelink | |
| Charles Edzer | $165,000 | -- | |
| The Fritsche Corp | $35,000 | Title First Agency Inc |
Source: Public Records
Mortgage History
| Date | Status | Borrower | Loan Amount |
|---|---|---|---|
| Open | Charles Edzer | $125,000 | |
| Closed | Charles Edzer | $131,750 | |
| Closed | Charles Edzer | $25,000 |
Source: Public Records
Tax History
| Year | Tax Paid | Tax Assessment Tax Assessment Total Assessment is a certain percentage of the fair market value that is determined by local assessors to be the total taxable value of land and additions on the property. | Land | Improvement |
|---|---|---|---|---|
| 2025 | $4,909 | $98,500 | $25,730 | $72,770 |
| 2024 | $4,909 | $98,500 | $25,730 | $72,770 |
| 2023 | $4,790 | $98,490 | $25,725 | $72,765 |
| 2022 | $4,513 | $70,840 | $12,040 | $58,800 |
| 2021 | $4,557 | $70,840 | $12,040 | $58,800 |
| 2020 | $4,542 | $70,840 | $12,040 | $58,800 |
| 2019 | $3,808 | $56,670 | $9,630 | $47,040 |
| 2018 | $3,491 | $56,670 | $9,630 | $47,040 |
| 2017 | $3,733 | $56,670 | $9,630 | $47,040 |
| 2016 | $3,253 | $45,050 | $9,770 | $35,280 |
| 2015 | $3,260 | $45,050 | $9,770 | $35,280 |
| 2014 | $3,263 | $45,050 | $9,770 | $35,280 |
| 2013 | $1,805 | $50,050 | $10,850 | $39,200 |
Source: Public Records
Map
Nearby Homes
- 0 Blendon Bend Way Unit 225037483
- 3563 Frenchpark Dr
- 3712 Creek Ridge Ct
- 3787 Harborough Dr
- 5000 Honeysuckle Blvd
- 3800 Mount Hood Ct
- 3288 Valley Ln S Unit Z8
- 5226 Spring Beauty Ct
- 4540 Hidden Ridge Ct
- 3292 Betty Ct
- 4920-4922 Magnolia Blossom Blvd
- 3344 Parklane Ave
- 4476 Cliff Ridge Dr
- 4575 Bimini Dr
- 4580 Fairgrove Rd
- 4560 Stonehedge Rd
- 3194 Adirondack Ave
- 5700 Crossing Ct Unit 4
- 3104 Palomar Ave
- 4125 Berryfield Dr
- 3546 Blendon Bend Way
- 3558 Blendon Bend Way
- 3538 Blendon Bend Way
- 3564 Blendon Bend Way
- 3530 Blendon Bend Way
- 3570 Blendon Bend Way
- 3551 Blendon Bend Way
- 3522 Blendon Bend Way
- 3576 Blendon Bend Way
- 3527 Blendon Bend Way
- 3514 Blendon Bend Way
- 3542 Jonathan Noble Way
- 3582 Blendon Bend Way
- 3519 Blendon Bend Way
- 3534 Jonathan Noble Way
- 3506 Blendon Bend Way
- 3511 Blendon Bend Way
- 3526 Jonathan Noble Way
- 3498 Blendon Bend Way
- 3588 Blendon Bend Way
Your Personal Tour Guide
Ask me questions while you tour the home.