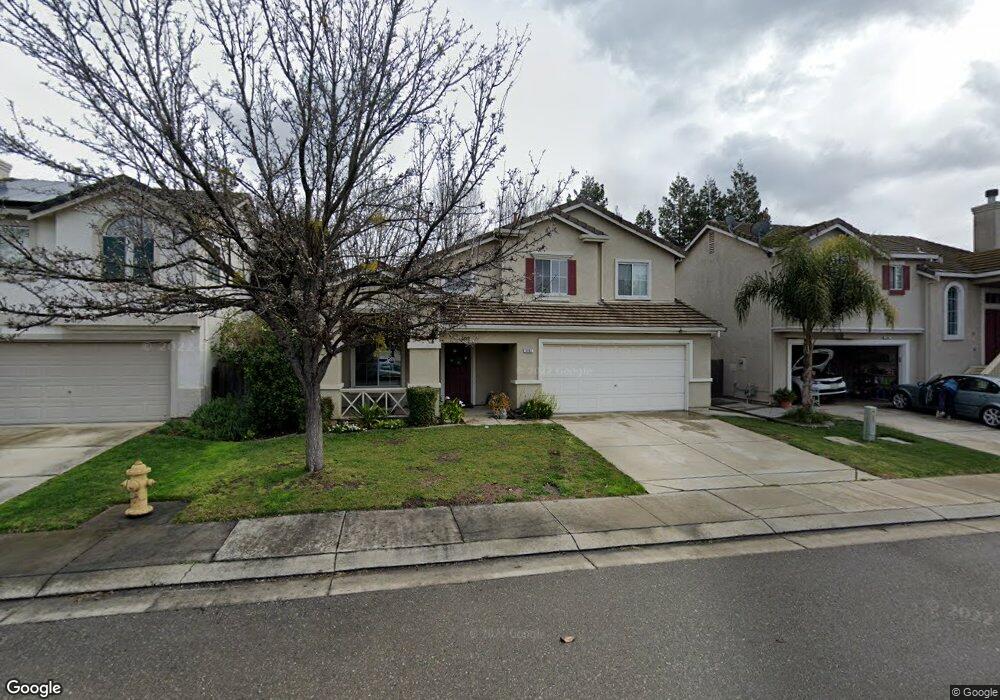
3553 Hepburn Cir Stockton, CA 95209
Spanos Park NeighborhoodEstimated Value: $463,666 - $527,000
3
Beds
2
Baths
1,883
Sq Ft
$262/Sq Ft
Est. Value
About This Home
This home is located at 3553 Hepburn Cir, Stockton, CA 95209 and is currently estimated at $492,917, approximately $261 per square foot. 3553 Hepburn Cir is a home located in San Joaquin County with nearby schools including Julia Morgan Elementary School, Christa McAuliffe Middle School, and Bear Creek High School.
Ownership History
Date
Name
Owned For
Owner Type
Purchase Details
Closed on
Apr 9, 2009
Sold by
Hsbc Bank Usa National Association
Bought by
Luchetta Anthony P and Luchetta Tiffany R
Current Estimated Value
Purchase Details
Closed on
Oct 5, 2008
Sold by
Huoth Samnang
Bought by
U S Bank National Association and Wfmbs 2007-004
Purchase Details
Closed on
Feb 9, 2007
Sold by
Tamayo Rod and Tamayo Melissa K
Bought by
Huoth Samnang
Home Financials for this Owner
Home Financials are based on the most recent Mortgage that was taken out on this home.
Original Mortgage
$308,800
Interest Rate
6.19%
Mortgage Type
Purchase Money Mortgage
Purchase Details
Closed on
Sep 1, 1999
Sold by
Re Development Corp
Bought by
Tamayo Rod and Tamayo Melissa K
Home Financials for this Owner
Home Financials are based on the most recent Mortgage that was taken out on this home.
Original Mortgage
$148,979
Interest Rate
8.09%
Mortgage Type
FHA
Create a Home Valuation Report for This Property
The Home Valuation Report is an in-depth analysis detailing your home's value as well as a comparison with similar homes in the area
Home Values in the Area
Average Home Value in this Area
Purchase History
| Date | Buyer | Sale Price | Title Company |
|---|---|---|---|
| Luchetta Anthony P | -- | Old Republic Title Company | |
| U S Bank National Association | $220,000 | Accommodation | |
| Huoth Samnang | $386,000 | Fidelity National Title Comp | |
| Tamayo Rod | $150,000 | Old Republic Title Company |
Source: Public Records
Mortgage History
| Date | Status | Borrower | Loan Amount |
|---|---|---|---|
| Previous Owner | Huoth Samnang | $308,800 | |
| Previous Owner | Tamayo Rod | $148,979 |
Source: Public Records
Tax History
| Year | Tax Paid | Tax Assessment Tax Assessment Total Assessment is a certain percentage of the fair market value that is determined by local assessors to be the total taxable value of land and additions on the property. | Land | Improvement |
|---|---|---|---|---|
| 2025 | $2,415 | $214,394 | $52,792 | $161,602 |
| 2024 | $2,372 | $210,191 | $51,757 | $158,434 |
| 2023 | $2,344 | $206,071 | $50,743 | $155,328 |
| 2022 | $2,293 | $202,032 | $49,749 | $152,283 |
| 2021 | $2,346 | $198,072 | $48,774 | $149,298 |
| 2020 | $2,290 | $196,042 | $48,274 | $147,768 |
| 2019 | $2,237 | $192,199 | $47,328 | $144,871 |
| 2018 | $2,197 | $188,431 | $46,400 | $142,031 |
| 2017 | $2,146 | $184,738 | $45,491 | $139,247 |
| 2016 | $2,021 | $181,117 | $44,599 | $136,518 |
| 2014 | $2,462 | $174,905 | $43,070 | $131,835 |
Source: Public Records
Map
Nearby Homes
- 3462 Hepburn Cir
- 3729 Hepburn Cir
- 3735 Ignacio Cir
- 3081 Joshua Tree Cir
- 9838 Sleepy Hollow Ct
- 3489 Canyonlands Rd Unit 1
- 2917 Estate Dr
- 3032 Dusty Ct
- 3144 Sweet Lilac Way
- 9975 River View Cir
- 3716 Des Moines Dr
- 2816 Otto Dr
- 10168 Creek Trail Cir
- 2616 Swainsons Hawk St
- 2337 Lonnie Beck Way
- 3309 Otto Dr
- 9578 Scarboro Place
- 2331 Autumn Oak Place
- 3731 Estate Dr
- 2316 Otto Dr
- 3547 Hepburn Cir
- 3281 English Oak Cir
- 3285 English Oak Cir
- 3541 Hepburn Cir
- 3565 Hepburn Cir
- 3277 English Oak Cir
- 3289 English Oak Cir
- 3273 English Oak Cir
- 3535 Hepburn Cir
- 3306 Mansfield Ct
- 3571 Hepburn Cir
- 3269 English Oak Cir
- 3297 English Oak Cir
- 3562 Hepburn Cir
- 3265 English Oak Cir
- 3301 English Oak Cir
- 3529 Hepburn Cir
- 3577 Hepburn Cir
- 3568 Hepburn Cir
Your Personal Tour Guide
Ask me questions while you tour the home.