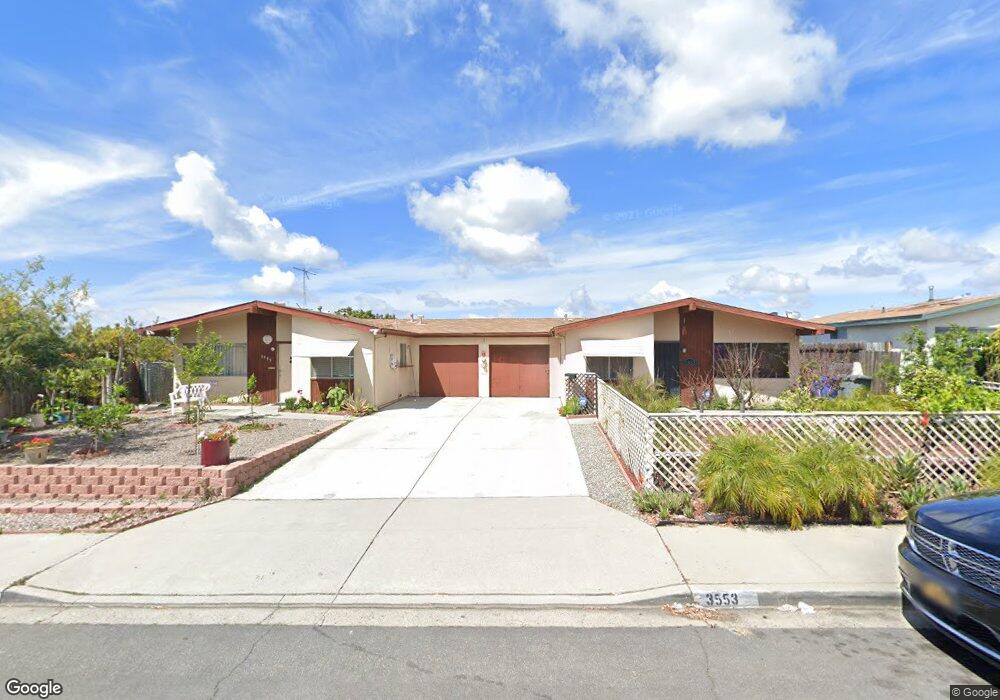
3553 Hollencrest Rd San Marcos, CA 92069
Estimated Value: $546,902 - $613,000
4
Beds
1
Bath
827
Sq Ft
$693/Sq Ft
Est. Value
About This Home
This home is located at 3553 Hollencrest Rd, San Marcos, CA 92069 and is currently estimated at $573,226, approximately $693 per square foot. 3553 Hollencrest Rd is a home located in San Diego County with nearby schools including La Mirada Academy, San Marcos Middle School, and San Marcos High School.
Ownership History
Date
Name
Owned For
Owner Type
Purchase Details
Closed on
Oct 28, 2019
Sold by
Correa Salvador V and Correa Maria Elena
Bought by
Sanchez Corona Jessika A
Current Estimated Value
Home Financials for this Owner
Home Financials are based on the most recent Mortgage that was taken out on this home.
Original Mortgage
$324,900
Outstanding Balance
$286,113
Interest Rate
3.65%
Mortgage Type
New Conventional
Estimated Equity
$287,114
Purchase Details
Closed on
Jun 8, 1994
Sold by
Erwin Helen Woodruff Marvin and Buesch Sylvia E
Bought by
Correa V Salvador V and Correa Maria Elena
Home Financials for this Owner
Home Financials are based on the most recent Mortgage that was taken out on this home.
Original Mortgage
$89,300
Interest Rate
4.75%
Create a Home Valuation Report for This Property
The Home Valuation Report is an in-depth analysis detailing your home's value as well as a comparison with similar homes in the area
Home Values in the Area
Average Home Value in this Area
Purchase History
| Date | Buyer | Sale Price | Title Company |
|---|---|---|---|
| Sanchez Corona Jessika A | $342,000 | Pacific Coast Title Company | |
| Correa V Salvador V | $94,000 | Fidelity National Title Co |
Source: Public Records
Mortgage History
| Date | Status | Borrower | Loan Amount |
|---|---|---|---|
| Open | Sanchez Corona Jessika A | $324,900 | |
| Previous Owner | Correa V Salvador V | $89,300 |
Source: Public Records
Tax History Compared to Growth
Tax History
| Year | Tax Paid | Tax Assessment Tax Assessment Total Assessment is a certain percentage of the fair market value that is determined by local assessors to be the total taxable value of land and additions on the property. | Land | Improvement |
|---|---|---|---|---|
| 2025 | $4,703 | $374,020 | $295,282 | $78,738 |
| 2024 | $4,703 | $366,688 | $289,493 | $77,195 |
| 2023 | $4,627 | $359,499 | $283,817 | $75,682 |
| 2022 | $4,573 | $352,451 | $278,252 | $74,199 |
| 2021 | $4,508 | $345,542 | $272,797 | $72,745 |
| 2020 | $4,471 | $342,000 | $270,000 | $72,000 |
| 2019 | $1,645 | $143,197 | $81,059 | $62,138 |
| 2018 | $1,593 | $140,390 | $79,470 | $60,920 |
| 2017 | $1,559 | $137,638 | $77,912 | $59,726 |
| 2016 | $1,535 | $134,940 | $76,385 | $58,555 |
| 2015 | $1,513 | $132,914 | $75,238 | $57,676 |
| 2014 | $1,479 | $130,312 | $73,765 | $56,547 |
Source: Public Records
Map
Nearby Homes
- 3511 Badillo Rd
- 3435 Capalina Rd Unit 10
- 155 Las Flores Dr Unit 36
- 155 Las Flores Dr Unit 136
- 155 Las Flores Dr Unit 25
- 1682 Saddlehorn Dr
- 1515 Capalina Rd Unit 42
- 1515 Capalina Rd Unit 71
- 3355 Descanso Ave
- 150 S Rancho Santa fe Rd Unit SPC 38
- 302 N Pacific St
- 2907 S Santa fe Ave Unit 10
- 2907 S Santa fe Ave Unit 64
- 3504 Grand Ave
- 507 Avenida Blanco
- 1387 Avenida Azul
- 2407 Saltbush Dr
- 2207 Saltbush Dr
- 2406 Saltbush Dr
- 2206 Saltbush Dr
- 3555 Hollencrest Rd
- 3549 Hollencrest Rd
- 3551 Hollencrest Rd
- 3526 Capalina Rd
- 3528 Capalina Rd
- 3515 Badillo Rd
- 3517 Badillo Rd Unit 1
- 3518 Capalina Rd
- 3520 Capalina Rd
- 3524 Badillo Rd
- 3522 Badillo Rd
- 3548 Hollencrest Rd Unit 1
- 3550 Hollencrest Rd
- 3534 Capalina Rd
- 3536 Capalina Rd
- 3547 Hollencrest Rd
- 3545 Hollencrest Rd
- 3509 Badillo Rd
- 3510 Capalina Rd
- 3512 Capalina Rd Unit 1