


3553 Pine Needle Dr SW Marietta, GA 30008
Southwestern Marietta NeighborhoodAbout This Home
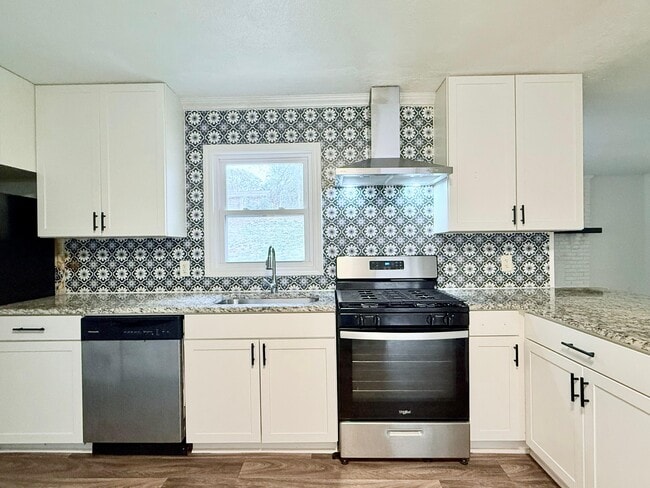
Why live in an apartment when you could be in an actual house?! Enjoy a comfortable open kitchen and two living room/dining room combos! The laundry room is very spacious as well. The entire unit has very good natural light, which shows in the pictures. Lawn service included! Please do not apply without first seeing the unit. Any applications received from people who haven't seen the property will be discarded as spam. All candidates seeing the unit will be required to show an original picture ID. Recent evictions or bankruptcies may disqualify you. A criminal background check will be run. Net income (individual if only 1 adult applying, or combined if 2 or more) must be at least 3 times the rent. Must have verifiable and positive rental history. For applicants with housing vouchers, the income requirement does not apply. If you have a voucher, it must be current, for at least three bedrooms and with the Marietta Housing Authority. We do not accept housing vouchers from DCA or Highland Rivers any longer. Applicants with housing vouchers will be required to show their voucher prior to scheduling a tour of the unit.

Map
- 1570 Halbrook Place SW
- Reynolds Plan at Hampton Trace
- Forsyth Plan at Hampton Trace
- 1539 Rockingway Dr SW
- 3517 Greenway Dr SW
- 1702 Merry Oak Rd SW
- 1810 Killarney Dr SW
- 3722 Willingham Run SW
- 3726 Willingham Run SW
- 3730 Willingham Run SW
- 1688 Lansmere St SW
- 1713 Lansmere St SW
- 1745 Lansmere St SW
- 1717 Lansmere St SW
- 1701 Lansmere St SW
- 1689 Lansmere St SW
- 3558 Pine Needle Dr SW
- 1626 Halbrook Place SW
- 3755 Medical Park Dr
- 3509 Ashley Station Dr SW Unit 3509 Ashley station Dr
- 1356 Velvet Creek Glen SW
- 3580 Main Station Dr SW
- 3414 Velvet Creek Dr SW
- 3753 Austell Rd SW Unit C1
- 3753 Austell Rd SW Unit B2
- 3753 Austell Rd SW Unit A1
- 3753 Austell Rd SW
- 3254 Ashgrove Ln SW
- 3890 Floyd Rd Unit C1HC
- 3890 Floyd Rd Unit Townhome-B1C
- 3890 Floyd Rd Unit B2
- 3890 Floyd Rd Unit A4
- 3890 Floyd Rd Unit A1
- 3555 Austell Rd SW
- 3897 Mulkey Cir SW
- 3890 Floyd Rd