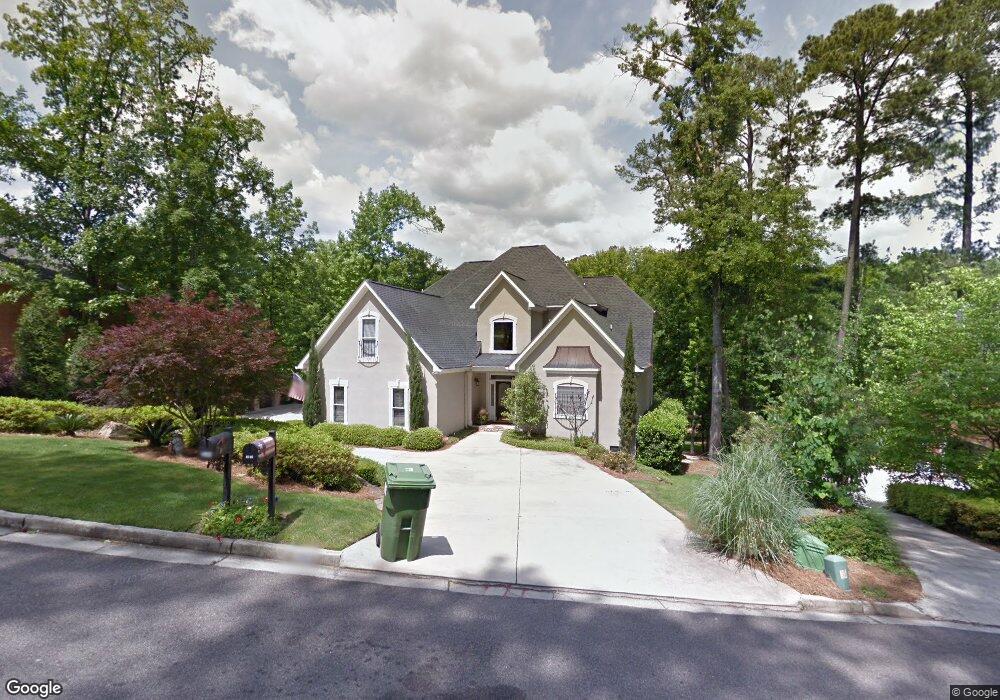
3553 Stevens Way Augusta, GA 30907
Estimated Value: $650,000 - $796,000
4
Beds
6
Baths
5,301
Sq Ft
$141/Sq Ft
Est. Value
About This Home
This home is located at 3553 Stevens Way, Augusta, GA 30907 and is currently estimated at $749,198, approximately $141 per square foot. 3553 Stevens Way is a home located in Columbia County with nearby schools including Stevens Creek Elementary School, Stallings Island Middle School, and Lakeside High School.
Ownership History
Date
Name
Owned For
Owner Type
Purchase Details
Closed on
Dec 26, 2003
Sold by
Antonakos Dean C
Bought by
Antonakos Dean C and Antonakos Sherry H
Current Estimated Value
Home Financials for this Owner
Home Financials are based on the most recent Mortgage that was taken out on this home.
Original Mortgage
$350,000
Interest Rate
2.87%
Mortgage Type
New Conventional
Purchase Details
Closed on
Dec 19, 2003
Sold by
Antonakos Sherry H
Bought by
Antonakos Dean C
Home Financials for this Owner
Home Financials are based on the most recent Mortgage that was taken out on this home.
Original Mortgage
$350,000
Interest Rate
2.87%
Mortgage Type
New Conventional
Purchase Details
Closed on
Dec 11, 2002
Sold by
Antonakos Dean C
Bought by
Antonakos Sherry H
Home Financials for this Owner
Home Financials are based on the most recent Mortgage that was taken out on this home.
Original Mortgage
$328,000
Interest Rate
6.07%
Create a Home Valuation Report for This Property
The Home Valuation Report is an in-depth analysis detailing your home's value as well as a comparison with similar homes in the area
Home Values in the Area
Average Home Value in this Area
Purchase History
| Date | Buyer | Sale Price | Title Company |
|---|---|---|---|
| Antonakos Dean C | -- | -- | |
| Antonakos Dean C | -- | -- | |
| Antonakos Sherry H | -- | -- |
Source: Public Records
Mortgage History
| Date | Status | Borrower | Loan Amount |
|---|---|---|---|
| Closed | Antonakos Dean C | $350,000 | |
| Closed | Antonakos Sherry H | $328,000 |
Source: Public Records
Tax History Compared to Growth
Tax History
| Year | Tax Paid | Tax Assessment Tax Assessment Total Assessment is a certain percentage of the fair market value that is determined by local assessors to be the total taxable value of land and additions on the property. | Land | Improvement |
|---|---|---|---|---|
| 2025 | $2,292 | $295,435 | $32,494 | $262,941 |
| 2024 | $2,165 | $269,279 | $32,302 | $236,977 |
| 2023 | $2,165 | $248,716 | $32,302 | $216,414 |
| 2022 | $2,059 | $233,777 | $31,438 | $202,339 |
| 2021 | $1,987 | $214,259 | $22,315 | $191,944 |
| 2020 | $1,860 | $192,350 | $23,947 | $168,403 |
| 2019 | $1,919 | $198,563 | $24,235 | $174,328 |
| 2018 | $1,724 | $176,190 | $20,490 | $155,700 |
| 2017 | $5,650 | $202,006 | $23,083 | $178,923 |
| 2016 | $5,202 | $192,864 | $22,194 | $170,670 |
| 2015 | $5,337 | $197,529 | $23,443 | $174,086 |
| 2014 | $5,075 | $185,517 | $18,353 | $167,164 |
Source: Public Records
Map
Nearby Homes
- 615 Stevens Crossing
- 3531 W Lake Dr
- 3526 W Lake Dr
- 466 Cambridge Way
- 3507 Lost Tree Ln
- 3553 Pebble Beach Dr
- 3506 Lost Tree Ln
- 482 Cambridge Way
- 3521 Pebble Beach Dr
- 3587 Oakmont Ct
- 3667 Foxfire Place
- 307 Old Salem Way
- 1119 Hampstead Place
- 3710 Inverness Way
- 4120 Shady Oaks Dr
- 3555 Watervale Way
- 3452 Rhodes Hill Dr
- 271 Watervale Rd
- 333 Old Salem Way
- 1094 Hampstead Place
- 3555 Stevens Way
- 3551 Stevens Way
- 3557 Stevens Way
- 3548 Stevens Way
- 3550 Stevens Way
- 3552 Stevens Way
- 3546 Stevens Way
- 3547 Stevens Way
- 3544 Stevens Way
- 3545 W Lake Dr
- 621 Stevens Crossing
- 3559 Stevens Way
- 3554 Stevens Way
- 623 Stevens Crossing
- 619 Stevens Crossing
- 3542 Stevens Way
- 625 Stevens Crossing
- 3561 Stevens Way
- 3545 Stevens Way
- 3556 Stevens Way