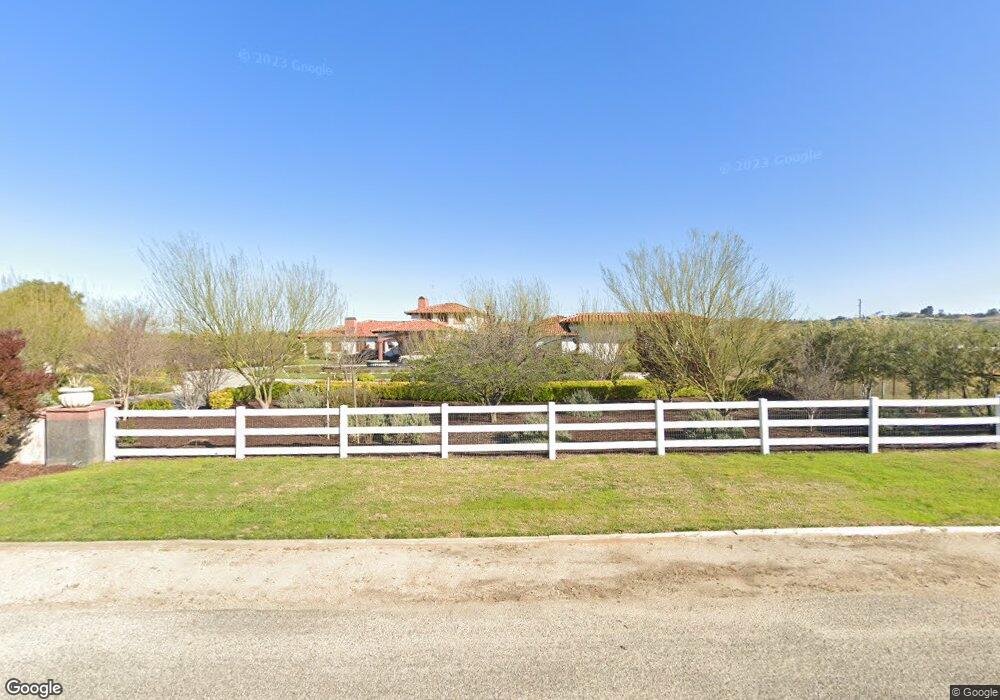
35536 Belle Chaine Loop Temecula, CA 92592
Estimated Value: $3,261,000
5
Beds
6
Baths
6,606
Sq Ft
$494/Sq Ft
Est. Value
About This Home
This home is located at 35536 Belle Chaine Loop, Temecula, CA 92592 and is currently estimated at $3,261,000, approximately $493 per square foot. 35536 Belle Chaine Loop is a home located in Riverside County with nearby schools including Tony Tobin Elementary School, Vail Ranch Middle School, and Great Oak High School.
Ownership History
Date
Name
Owned For
Owner Type
Purchase Details
Closed on
Jun 7, 2016
Sold by
Velasco Law Group Apc
Bought by
Rodriguez Juan D and Rodriguez Maricela
Current Estimated Value
Purchase Details
Closed on
Aug 7, 2012
Sold by
First Union Holdings Llc
Bought by
Stump Branden J and Stump Kimberly K
Purchase Details
Closed on
Apr 25, 2007
Sold by
Gomez Jose L and Rodriguez Juan D
Bought by
Rodriguez Juan D and Rodriguez Maricela
Purchase Details
Closed on
May 9, 2005
Sold by
Gomez Anna A
Bought by
Gomez Jose L
Purchase Details
Closed on
Apr 26, 2005
Sold by
Cheval Creek Inc
Bought by
Rodriguez Juan D and Gomez Jose L
Create a Home Valuation Report for This Property
The Home Valuation Report is an in-depth analysis detailing your home's value as well as a comparison with similar homes in the area
Purchase History
| Date | Buyer | Sale Price | Title Company |
|---|---|---|---|
| Rodriguez Juan D | -- | None Available | |
| Stump Branden J | $350,000 | First American Title | |
| Stump Branden J | $1,750,000 | First American Title | |
| Rodriguez Juan D | -- | None Available | |
| Gomez Jose L | -- | First American Title Co | |
| Rodriguez Juan D | -- | First American Title Co | |
| Rodriguez Juan D | $585,000 | First American Title Co |
Source: Public Records
Tax History
| Year | Tax Paid | Tax Assessment Tax Assessment Total Assessment is a certain percentage of the fair market value that is determined by local assessors to be the total taxable value of land and additions on the property. | Land | Improvement |
|---|---|---|---|---|
| 2025 | $23,757 | $2,109,537 | $815,431 | $1,294,106 |
| 2023 | $23,757 | $2,027,623 | $783,768 | $1,243,855 |
| 2022 | $23,069 | $1,987,866 | $768,400 | $1,219,466 |
| 2021 | $21,727 | $1,863,189 | $753,334 | $1,109,855 |
| 2020 | $21,505 | $1,844,085 | $745,610 | $1,098,475 |
| 2019 | $21,184 | $1,807,928 | $730,991 | $1,076,937 |
| 2018 | $20,786 | $1,772,479 | $716,659 | $1,055,820 |
| 2017 | $20,345 | $1,737,725 | $702,607 | $1,035,118 |
| 2016 | $19,999 | $1,703,653 | $688,831 | $1,014,822 |
| 2015 | $19,641 | $1,678,065 | $678,485 | $999,580 |
| 2014 | $19,074 | $1,645,196 | $665,196 | $980,000 |
Source: Public Records
Map
Nearby Homes
- 36500 De Portola Rd
- 38831 Pauba Rd
- 0 Linda Rosea Unit SW25241834
- 0 Los Caballos Rd
- 42780 India Place
- 37028 De Portola Rd
- 41987 Arbor Glen Dr
- 35251 Calle Campo
- 41907 Arbor Glen Dr
- 41770 Knoll Vista Ln
- 34675 Cotta Ln
- 33319 Linda Rosea Rd
- 34387 Coppola St
- 35715 Calle Nopal
- 34349 Lamborn St
- 34970 Calle Campo
- 44591 Ristow Ct
- 38950 Hoss St
- 0 Summit Cir Unit SW26043370
- 41955 Altanos Rd
- 365820 Belle Chaine Loop
- 34643 Belle Chaine Loop
- 35673 Belle Chaine Loop
- 35325 De Portola Rd
- 35735 Belle Chaine Loop
- 35643 Belle Chaine Loop
- 35310 De Portola Rd Unit n/a
- 35310 De Portola Rd
- 35820 Belle Chaine Loop
- 35560 De Portola Rd
- 35480 De Portola Rd
- 35797 Belle Chaine Loop
- 35879 Belle Chaine Loop
- 35851 Belle Chaine Loop
- 0 Avenida Felicita Unit SW14070700
- 14 Los Corralitos Rd
- 35917 Belle Chaine Loop
- 35675 De Portola Rd
- 43385 Avenida Felicita
- 35438 De Portola Rd
Your Personal Tour Guide
Ask me questions while you tour the home.