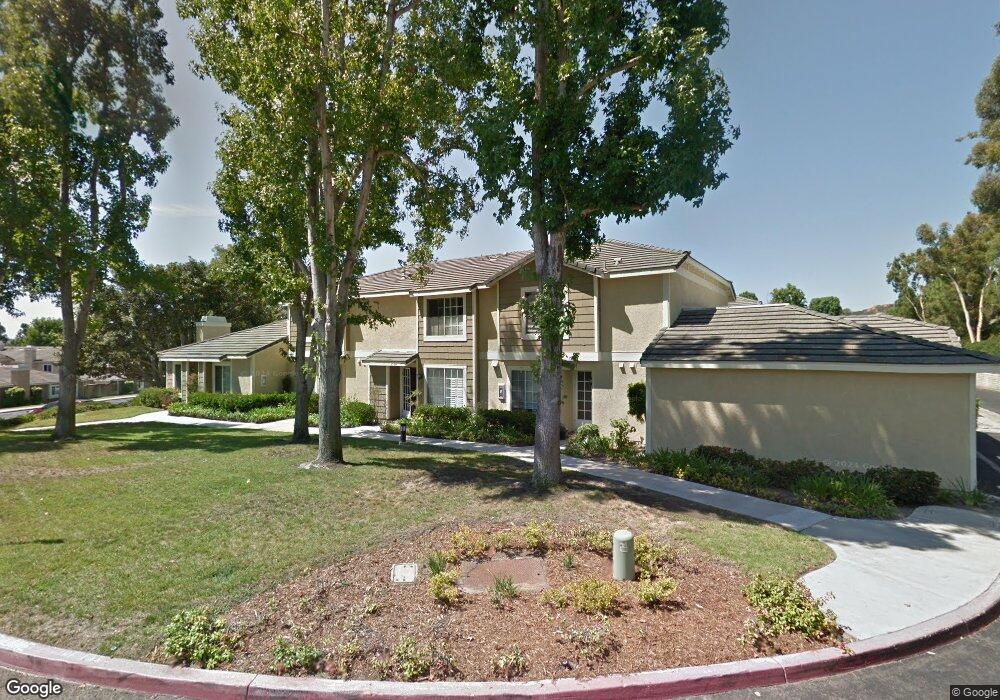
3558 Caminito Carmel Landing San Diego, CA 92130
Carmel Valley NeighborhoodEstimated Value: $811,794 - $1,021,000
2
Beds
2
Baths
1,068
Sq Ft
$854/Sq Ft
Est. Value
About This Home
This home is located at 3558 Caminito Carmel Landing, San Diego, CA 92130 and is currently estimated at $912,449, approximately $854 per square foot. 3558 Caminito Carmel Landing is a home located in San Diego County with nearby schools including Carmel Del Mar Elementary School, Carmel Valley Middle School, and Torrey Pines High School.
Ownership History
Date
Name
Owned For
Owner Type
Purchase Details
Closed on
Mar 9, 2015
Sold by
Mayo John B and Mayo Cecelia A Kemper
Bought by
Vandamme Andrew and Vandamme Maria K
Current Estimated Value
Home Financials for this Owner
Home Financials are based on the most recent Mortgage that was taken out on this home.
Original Mortgage
$495,000
Interest Rate
3.73%
Mortgage Type
New Conventional
Purchase Details
Closed on
Aug 25, 1998
Sold by
Banks Michael E
Bought by
Mayo John B and Kemper Mayo Cecelia A
Home Financials for this Owner
Home Financials are based on the most recent Mortgage that was taken out on this home.
Original Mortgage
$140,000
Interest Rate
6.91%
Mortgage Type
Purchase Money Mortgage
Purchase Details
Closed on
May 2, 1996
Sold by
Banks Frances Leigh
Bought by
Banks Michael E
Purchase Details
Closed on
Sep 28, 1990
Purchase Details
Closed on
Sep 20, 1984
Create a Home Valuation Report for This Property
The Home Valuation Report is an in-depth analysis detailing your home's value as well as a comparison with similar homes in the area
Home Values in the Area
Average Home Value in this Area
Purchase History
| Date | Buyer | Sale Price | Title Company |
|---|---|---|---|
| Vandamme Andrew | $550,000 | Equity Title Company | |
| Mayo John B | $175,000 | -- | |
| Banks Michael E | -- | -- | |
| -- | $182,900 | -- | |
| -- | $110,600 | -- |
Source: Public Records
Mortgage History
| Date | Status | Borrower | Loan Amount |
|---|---|---|---|
| Previous Owner | Vandamme Andrew | $495,000 | |
| Previous Owner | Mayo John B | $140,000 |
Source: Public Records
Tax History Compared to Growth
Tax History
| Year | Tax Paid | Tax Assessment Tax Assessment Total Assessment is a certain percentage of the fair market value that is determined by local assessors to be the total taxable value of land and additions on the property. | Land | Improvement |
|---|---|---|---|---|
| 2025 | $6,943 | $661,008 | $420,641 | $240,367 |
| 2024 | $6,943 | $648,048 | $412,394 | $235,654 |
| 2023 | $6,787 | $635,342 | $404,308 | $231,034 |
| 2022 | $6,673 | $622,885 | $396,381 | $226,504 |
| 2021 | $6,428 | $610,672 | $388,609 | $222,063 |
| 2020 | $6,483 | $604,412 | $384,625 | $219,787 |
| 2019 | $6,356 | $592,562 | $377,084 | $215,478 |
| 2018 | $6,076 | $580,944 | $369,691 | $211,253 |
| 2017 | $81 | $569,554 | $362,443 | $207,111 |
| 2016 | $5,766 | $558,387 | $355,337 | $203,050 |
| 2015 | $2,433 | $228,259 | $141,681 | $86,578 |
| 2014 | $2,385 | $223,789 | $138,906 | $84,883 |
Source: Public Records
Map
Nearby Homes
- 12165 Caminito Mira Del Mar
- 12221 Caminito Mira Del Mar
- 12233 Caminito Del Mar Sands
- 3672 Caminito Carmel Landing
- 3714 Carmel View Rd
- 12213 Carmel Vista Rd Unit 234
- 3686 Ruette de Ville
- 3519 Caminito el Rincon Unit 300
- 3545 Caminito el Rincon Unit 237
- 3537 Caminito el Rincon Unit 259
- 4065 Carmel View Rd Unit 24
- 12585 Ruette Alliante Unit 152
- 3550 Caminito el Rincon Unit 69
- 4049 Carmel View Rd Unit 75
- 4049 Carmel View Rd Unit 74
- 13147 Portofino Dr
- 4042 Moratalla Terrace
- 3975 San Gregorio Way
- 3718 Mykonos Ln Unit 158
- 12999 Caminito Pointe Del Mar
- 3556 Caminito Carmel Landing
- 3552 Caminito Carmel Landing
- 3652 Caminito Carmel Landing Unit 145
- 3542 Caminito Carmel Landing
- 3542 Cmt Carmel Landing Unit 154
- 3642 Caminito Carmel Landing
- 3654 Caminito Carmel Landing Unit 144
- 3644 Caminito Carmel Landing
- 3644 Caminito Carmel Landing
- 3656 Caminito Carmel Landing
- 3646 Cmt Carmel Landing Unit 140
- 3658 Caminito Carmel Landing
- 3646 Caminito Carmel Landing
- 3632 Caminito Carmel Landing
- 3634 Caminito Carmel Landing
- 3636 Caminito Carmel Landing
- 3512 Caminito Carmel Landing
- 3522 Caminito Carmel Landing
- 3534 Caminito Carmel Landing
- 3506 Caminito Carmel Landing