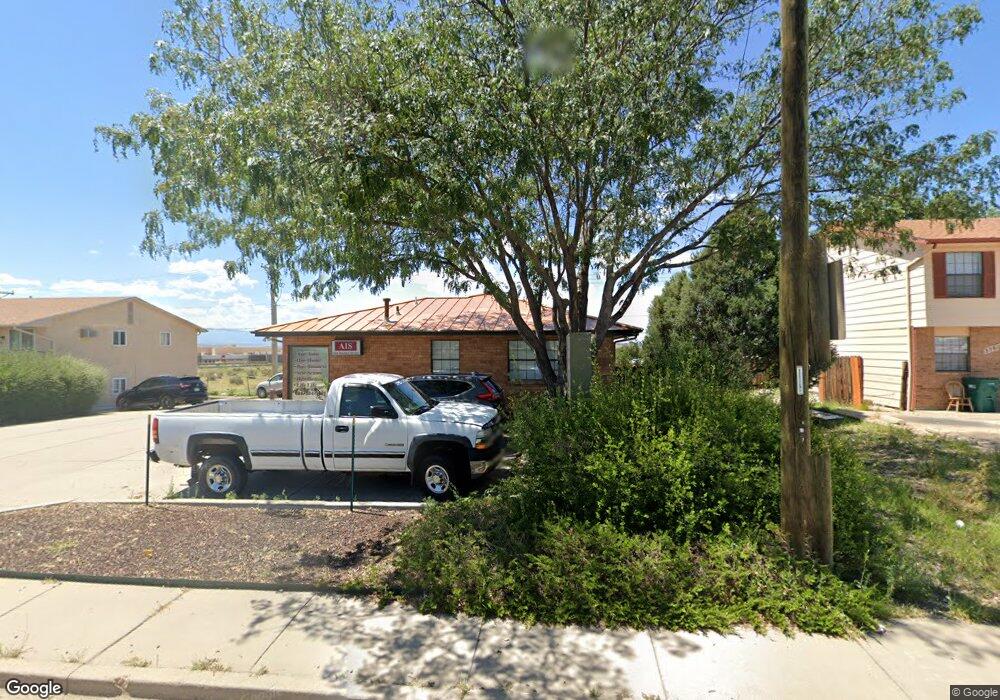
3559 Baltimore Ave Pueblo, CO 81008
Skyview NeighborhoodEstimated Value: $333,118 - $350,000
--
Bed
--
Bath
1,694
Sq Ft
$202/Sq Ft
Est. Value
About This Home
This home is located at 3559 Baltimore Ave, Pueblo, CO 81008 and is currently estimated at $341,559, approximately $201 per square foot. 3559 Baltimore Ave is a home located in Pueblo County with nearby schools including Morton Elementary School, Risley International Academy of Innovation, and Centennial High School.
Ownership History
Date
Name
Owned For
Owner Type
Purchase Details
Closed on
Feb 1, 2016
Sold by
Eller Stven C
Bought by
Allen Jolynn D and Allen Jason L
Current Estimated Value
Home Financials for this Owner
Home Financials are based on the most recent Mortgage that was taken out on this home.
Original Mortgage
$120,800
Outstanding Balance
$96,424
Interest Rate
3.99%
Mortgage Type
Commercial
Estimated Equity
$245,135
Purchase Details
Closed on
Nov 20, 2015
Sold by
Boren Lisa A
Bought by
Eller Steven C
Purchase Details
Closed on
Aug 7, 2015
Sold by
Boren Michael C
Bought by
Boren Lisa A
Purchase Details
Closed on
Feb 24, 2000
Sold by
House Mark T
Bought by
Boren Michael C
Purchase Details
Closed on
Apr 2, 1997
Sold by
House Mark T + Alison C
Bought by
House Mark T
Purchase Details
Closed on
Feb 16, 1988
Sold by
Hall Thomas N
Bought by
House Mark T + Alison C
Purchase Details
Closed on
Aug 27, 1979
Sold by
Baltimore Ltd
Bought by
Hall Thomas N
Create a Home Valuation Report for This Property
The Home Valuation Report is an in-depth analysis detailing your home's value as well as a comparison with similar homes in the area
Home Values in the Area
Average Home Value in this Area
Purchase History
| Date | Buyer | Sale Price | Title Company |
|---|---|---|---|
| Allen Jolynn D | $151,000 | Land Title Guarantee Company | |
| Eller Steven C | $95,000 | Land Title Guarantee Company | |
| Boren Lisa A | -- | None Available | |
| Boren Michael C | $188,000 | -- | |
| House Mark T | -- | -- | |
| House Mark T + Alison C | $75,000 | -- | |
| Hall Thomas N | -- | -- |
Source: Public Records
Mortgage History
| Date | Status | Borrower | Loan Amount |
|---|---|---|---|
| Open | Allen Jolynn D | $120,800 |
Source: Public Records
Tax History Compared to Growth
Tax History
| Year | Tax Paid | Tax Assessment Tax Assessment Total Assessment is a certain percentage of the fair market value that is determined by local assessors to be the total taxable value of land and additions on the property. | Land | Improvement |
|---|---|---|---|---|
| 2024 | $1,921 | $19,960 | -- | -- |
| 2023 | $1,942 | $28,330 | $9,740 | $18,590 |
| 2022 | $2,868 | $29,320 | $10,120 | $19,200 |
| 2021 | $2,878 | $29,320 | $10,120 | $19,200 |
| 2020 | $4,148 | $29,320 | $10,120 | $19,200 |
| 2019 | $4,149 | $41,670 | $9,249 | $32,421 |
| 2018 | $3,859 | $43,249 | $9,249 | $34,000 |
| 2017 | $3,898 | $43,249 | $9,249 | $34,000 |
| 2016 | $2,874 | $31,948 | $9,249 | $22,699 |
| 2015 | $1,432 | $31,948 | $9,249 | $22,699 |
| 2014 | $2,721 | $30,305 | $9,249 | $21,056 |
Source: Public Records
Map
Nearby Homes
- Lot 3 Kachina Dr
- 2110 Northmoor Terrace Unit 2
- 2108 Northmoor Terrace
- 3407 Baltimore Ave
- 1910 Lynda Ln
- 1908 Lynda Ln
- 3230 Shalimar Terrace
- 1903 Northmoor Terrace
- 3241 Shalimar Terrace
- 3601 Morris Ave
- 3214 Shalimar Terrace
- 3223 Baltimore Ave Unit 3225
- 3210 Shalimar Terrace
- 3216 Baltimore Ave
- 3303 Morris Ave
- 3217 Colfax Ave
- 3410 Northridge Dr
- 4042 N Peakview Dr
- 3561 Baltimore Ave Unit 3567
- 3551 Baltimore Ave
- 3531 Baltimore Ave
- 0 W Kachina Dr Unit 2 157486
- 3521 Baltimore Ave
- 3511 Baltimore Ave
- 3631 Baltimore Ave
- 3540 Baltimore Ave Unit 124
- 3501 Baltimore Ave Unit 3503
- 3501 Baltimore Ave
- 2036 Kachina Dr Unit 2038
- 2036 Kachina Dr
- 3520 Baltimore Ave
- 3520 Baltimore Ave Unit 3520-3540
- 2060 W Us Highway 50
- 3637 Baltimore Ave
- 3471 Baltimore Ave
- 2060 U S 50
- 3461 Baltimore Ave
- 3461 Baltimore Ave Unit 4