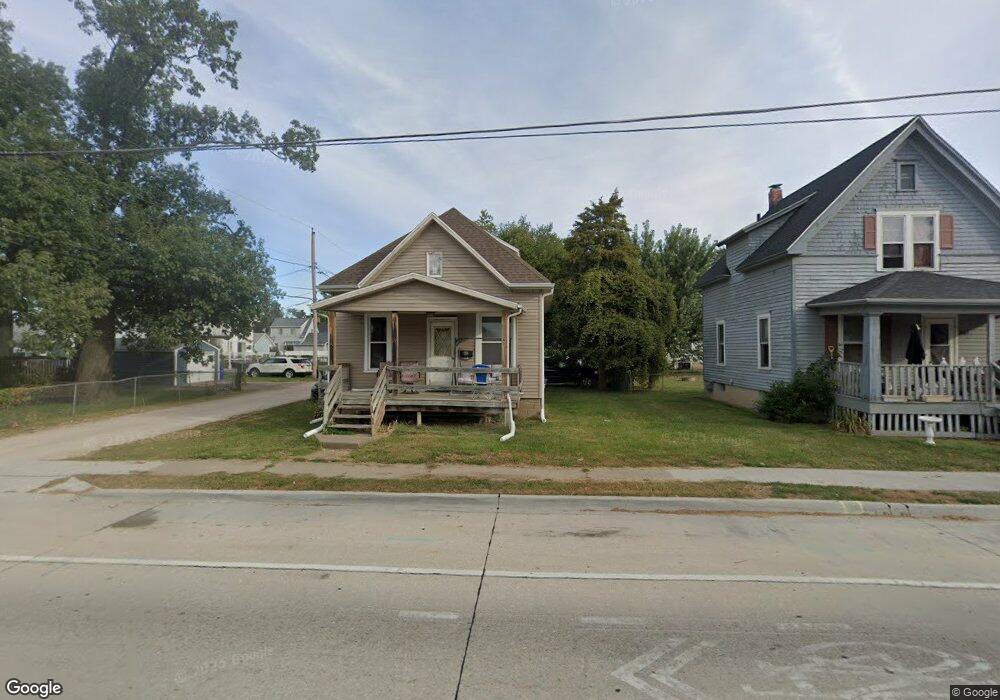
356 15th Ave SW Cedar Rapids, IA 52404
Taylor NeighborhoodEstimated Value: $110,000 - $150,000
2
Beds
2
Baths
1,228
Sq Ft
$107/Sq Ft
Est. Value
About This Home
This home is located at 356 15th Ave SW, Cedar Rapids, IA 52404 and is currently estimated at $131,391, approximately $106 per square foot. 356 15th Ave SW is a home located in Linn County with nearby schools including Junction City Elementary School, Cedar River Academy at Taylor Elementary School, and Bruce Hall Day Treatment Center.
Ownership History
Date
Name
Owned For
Owner Type
Purchase Details
Closed on
Sep 1, 1998
Sold by
Kenjar Raif and Kenjar Ismeta
Bought by
Barnett Steven W and Barnett Lori L
Current Estimated Value
Home Financials for this Owner
Home Financials are based on the most recent Mortgage that was taken out on this home.
Original Mortgage
$60,941
Outstanding Balance
$12,846
Interest Rate
7.04%
Mortgage Type
FHA
Estimated Equity
$118,545
Create a Home Valuation Report for This Property
The Home Valuation Report is an in-depth analysis detailing your home's value as well as a comparison with similar homes in the area
Home Values in the Area
Average Home Value in this Area
Purchase History
| Date | Buyer | Sale Price | Title Company |
|---|---|---|---|
| Barnett Steven W | $60,500 | -- |
Source: Public Records
Mortgage History
| Date | Status | Borrower | Loan Amount |
|---|---|---|---|
| Open | Barnett Steven W | $60,941 |
Source: Public Records
Tax History Compared to Growth
Tax History
| Year | Tax Paid | Tax Assessment Tax Assessment Total Assessment is a certain percentage of the fair market value that is determined by local assessors to be the total taxable value of land and additions on the property. | Land | Improvement |
|---|---|---|---|---|
| 2025 | $1,686 | $112,400 | $27,500 | $84,900 |
| 2024 | $1,766 | $105,700 | $25,400 | $80,300 |
| 2023 | $1,766 | $105,700 | $25,400 | $80,300 |
| 2022 | $1,558 | $92,600 | $21,200 | $71,400 |
| 2021 | $1,548 | $84,200 | $21,200 | $63,000 |
| 2020 | $1,548 | $78,800 | $19,000 | $59,800 |
| 2019 | $1,470 | $76,700 | $19,000 | $57,700 |
| 2018 | $1,424 | $76,700 | $19,000 | $57,700 |
| 2017 | $1,701 | $70,200 | $19,000 | $51,200 |
| 2016 | $1,701 | $80,000 | $19,000 | $61,000 |
| 2015 | $1,679 | $78,935 | $19,035 | $59,900 |
| 2014 | $1,494 | $78,935 | $19,035 | $59,900 |
| 2013 | $1,458 | $78,935 | $19,035 | $59,900 |
Source: Public Records
Map
Nearby Homes