Estimated Value: $387,000 - $558,000
4
Beds
3
Baths
2,737
Sq Ft
$179/Sq Ft
Est. Value
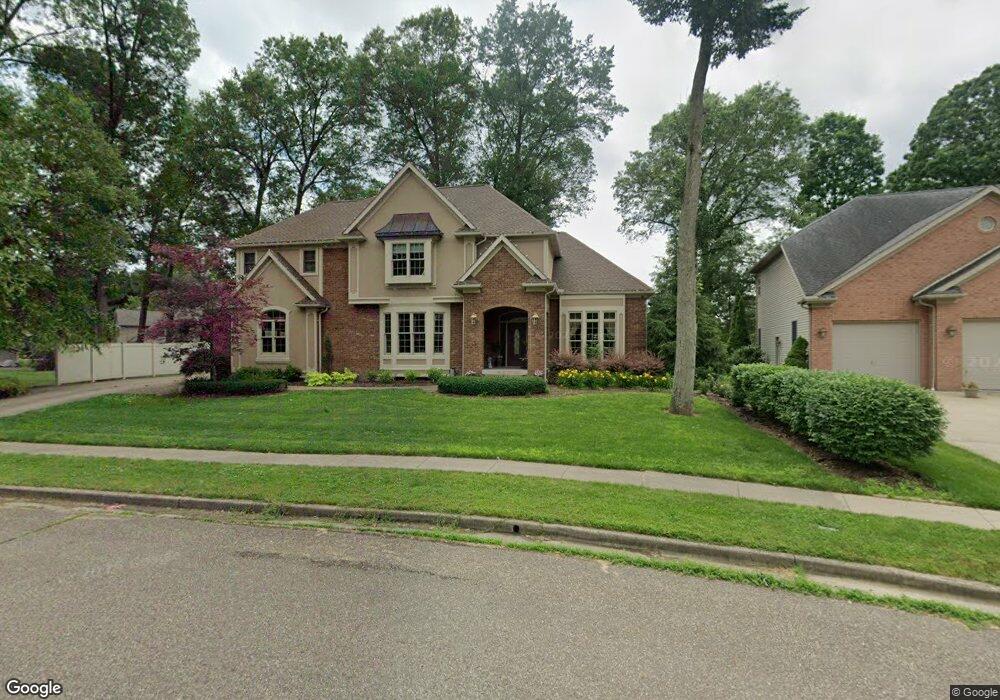
About This Home
This home is located at 356 Aspen Dr, Dover, OH 44622 and is currently estimated at $490,940, approximately $179 per square foot. 356 Aspen Dr is a home located in Tuscarawas County with nearby schools including Dover High School and Tuscarawas Central Catholic Elementary School.
Ownership History
Date
Name
Owned For
Owner Type
Purchase Details
Closed on
Nov 15, 2006
Sold by
Manella Randy L and Manella Debra L
Bought by
Kellicker Marc A and Kellicker Lisa M
Current Estimated Value
Purchase Details
Closed on
Feb 17, 2004
Sold by
M & P Development Tuscarawas County Ltd
Bought by
Manella Randy L and Manella Debra L
Home Financials for this Owner
Home Financials are based on the most recent Mortgage that was taken out on this home.
Original Mortgage
$83,500
Interest Rate
5.96%
Mortgage Type
Purchase Money Mortgage
Purchase Details
Closed on
Nov 4, 2003
Sold by
Rr Stark Co
Bought by
M & P Development Of Tuscarawas County L
Home Financials for this Owner
Home Financials are based on the most recent Mortgage that was taken out on this home.
Original Mortgage
$1,000,000
Interest Rate
6.02%
Mortgage Type
Purchase Money Mortgage
Create a Home Valuation Report for This Property
The Home Valuation Report is an in-depth analysis detailing your home's value as well as a comparison with similar homes in the area
Home Values in the Area
Average Home Value in this Area
Purchase History
| Date | Buyer | Sale Price | Title Company |
|---|---|---|---|
| Kellicker Marc A | $38,000 | None Available | |
| Manella Randy L | $84,000 | -- | |
| M & P Development Of Tuscarawas County L | $1,085,000 | -- |
Source: Public Records
Mortgage History
| Date | Status | Borrower | Loan Amount |
|---|---|---|---|
| Closed | Manella Randy L | $83,500 | |
| Closed | M & P Development Of Tuscarawas County L | $1,000,000 |
Source: Public Records
Tax History
| Year | Tax Paid | Tax Assessment Tax Assessment Total Assessment is a certain percentage of the fair market value that is determined by local assessors to be the total taxable value of land and additions on the property. | Land | Improvement |
|---|---|---|---|---|
| 2024 | $6,310 | $147,480 | $21,400 | $126,080 |
| 2023 | $6,310 | $421,380 | $61,150 | $360,230 |
| 2022 | $6,370 | $147,483 | $21,403 | $126,081 |
| 2021 | $6,007 | $130,593 | $20,066 | $110,527 |
| 2020 | $6,008 | $130,593 | $20,066 | $110,527 |
| 2019 | $6,051 | $130,593 | $20,066 | $110,527 |
| 2018 | $5,774 | $117,860 | $18,110 | $99,750 |
| 2017 | $5,775 | $117,860 | $18,110 | $99,750 |
| 2016 | $5,778 | $117,860 | $18,110 | $99,750 |
| 2014 | $4,909 | $108,870 | $17,040 | $91,830 |
| 2013 | $4,915 | $108,060 | $17,040 | $91,020 |
Source: Public Records
Map
Nearby Homes
- 209 Aspen Dr Unit 209
- 213 E 27th St
- 2815 Race St
- 312 E 21st St
- 107 W 21st St
- 0 Ohio Ave Unit 5188259
- 3030 N Wooster Ave
- 0 W Ohio Ave
- 201 E 12th St
- 212 E 11th St
- 1220 Chestnut St
- 1108 N Walnut St
- 0 Blacksnake Hill Rd Unit 5190300
- 601 E 4th St
- 715 N Walnut St
- 2404 Lowden St NW
- 1102 E Front St
- 210 W 4th St
- 835 Chelsea Dr
- 3156 Josephine St NW
Your Personal Tour Guide
Ask me questions while you tour the home.