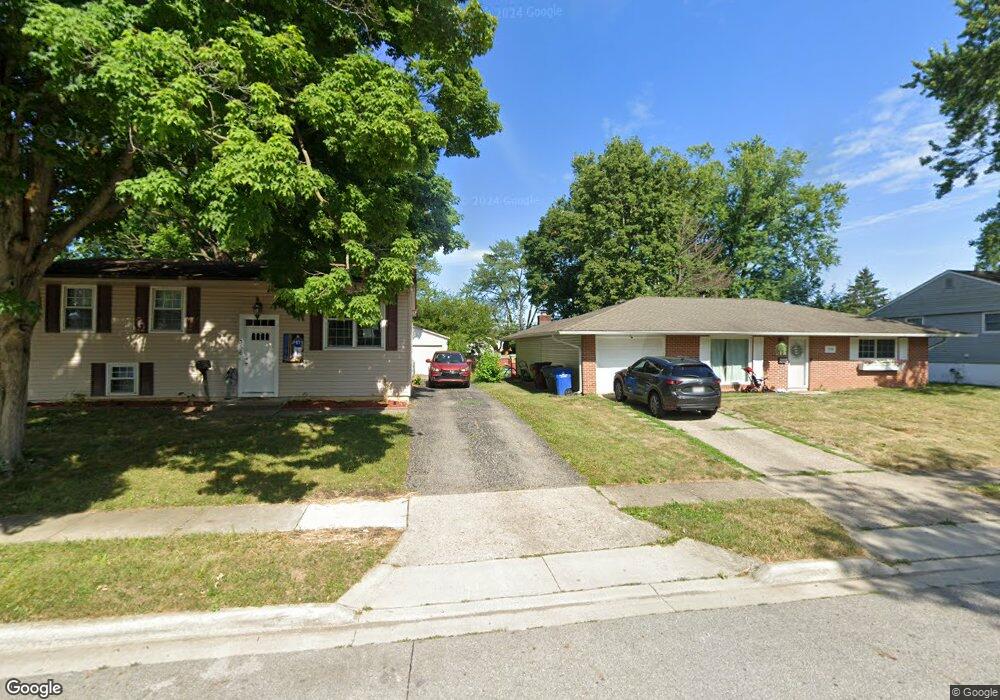
356 Avonwick Place Columbus, OH 43230
Estimated Value: $264,000 - $303,000
3
Beds
2
Baths
1,447
Sq Ft
$197/Sq Ft
Est. Value
About This Home
This home is located at 356 Avonwick Place, Columbus, OH 43230 and is currently estimated at $284,851, approximately $196 per square foot. 356 Avonwick Place is a home located in Franklin County with nearby schools including Chapelfield Elementary School, Gahanna West Middle School, and Lincoln High School.
Ownership History
Date
Name
Owned For
Owner Type
Purchase Details
Closed on
Aug 28, 2019
Sold by
Booth Curtis and Estate Of Mickel Ray Booth
Bought by
Rodgers Nathan R and Rodgers Bonnie E
Current Estimated Value
Home Financials for this Owner
Home Financials are based on the most recent Mortgage that was taken out on this home.
Original Mortgage
$126,000
Outstanding Balance
$110,592
Interest Rate
3.7%
Mortgage Type
New Conventional
Estimated Equity
$174,259
Purchase Details
Closed on
Aug 31, 1999
Sold by
Jordan Loren G and Jordan Mary E
Bought by
Booth Mickel R
Home Financials for this Owner
Home Financials are based on the most recent Mortgage that was taken out on this home.
Original Mortgage
$104,039
Interest Rate
7.59%
Mortgage Type
FHA
Purchase Details
Closed on
Dec 14, 1989
Bought by
Jordan Loren G
Purchase Details
Closed on
Dec 1, 1984
Purchase Details
Closed on
Aug 1, 1983
Create a Home Valuation Report for This Property
The Home Valuation Report is an in-depth analysis detailing your home's value as well as a comparison with similar homes in the area
Home Values in the Area
Average Home Value in this Area
Purchase History
| Date | Buyer | Sale Price | Title Company |
|---|---|---|---|
| Rodgers Nathan R | $168,000 | None Available | |
| Booth Mickel R | $104,900 | -- | |
| Jordan Loren G | $69,900 | -- | |
| -- | $50,400 | -- | |
| -- | $50,600 | -- |
Source: Public Records
Mortgage History
| Date | Status | Borrower | Loan Amount |
|---|---|---|---|
| Open | Rodgers Nathan R | $126,000 | |
| Closed | Booth Mickel R | $104,039 |
Source: Public Records
Tax History Compared to Growth
Tax History
| Year | Tax Paid | Tax Assessment Tax Assessment Total Assessment is a certain percentage of the fair market value that is determined by local assessors to be the total taxable value of land and additions on the property. | Land | Improvement |
|---|---|---|---|---|
| 2024 | $4,706 | $78,300 | $23,420 | $54,880 |
| 2023 | $4,648 | $78,300 | $23,420 | $54,880 |
| 2022 | $6,591 | $58,280 | $12,640 | $45,640 |
| 2021 | $4,299 | $58,280 | $12,640 | $45,640 |
| 2020 | $4,265 | $58,280 | $12,640 | $45,640 |
| 2019 | $3,613 | $49,110 | $10,540 | $38,570 |
| 2018 | $2,679 | $49,110 | $10,540 | $38,570 |
| 2017 | $2,659 | $49,110 | $10,540 | $38,570 |
| 2016 | $2,481 | $43,050 | $10,430 | $32,620 |
| 2015 | $2,483 | $43,050 | $10,430 | $32,620 |
| 2014 | $2,464 | $43,050 | $10,430 | $32,620 |
| 2013 | $1,223 | $43,050 | $10,430 | $32,620 |
Source: Public Records
Map
Nearby Homes
- 404 Foxwood Dr
- 343 Imperial Dr
- 470 Deerwood Ave E
- 278 Empire Dr
- 3610 N Stygler Rd
- 463 Lincolnshire Rd
- 175 Stonegate Cir
- 668 Kenilworth Ct
- 221 Lincolnshire Rd
- 364 Morgan Ln
- 427 Amesbury Dr
- 642 Ridenour Rd
- 600 Agler Rd
- 536 Springwood Lake Dr
- 4131 Claver Dr
- 2741 Acarie Dr
- 4093 Adalric Dr
- 2851 Acarie Dr
- 3877 Hines Rd
- 2694 Kantian Dr
- 350 Avonwick Place
- 385 Coronation Ave
- 357 N Stygler Rd
- 344 Avonwick Place
- 349 N Stygler Rd
- 365 N Stygler Rd
- 355 Avonwick Place
- 343 N Stygler Rd
- 351 Avonwick Place
- 367 Avonwick Place
- 338 Avonwick Place
- 345 Avonwick Place
- 386 Coronation Ave
- 392 Coronation Ave
- 337 N Stygler Rd
- 380 Coronation Ave
- 400 Coronation Ave
- 332 Avonwick Place
- 335 Avonwick Place
- 379 N Stygler Rd