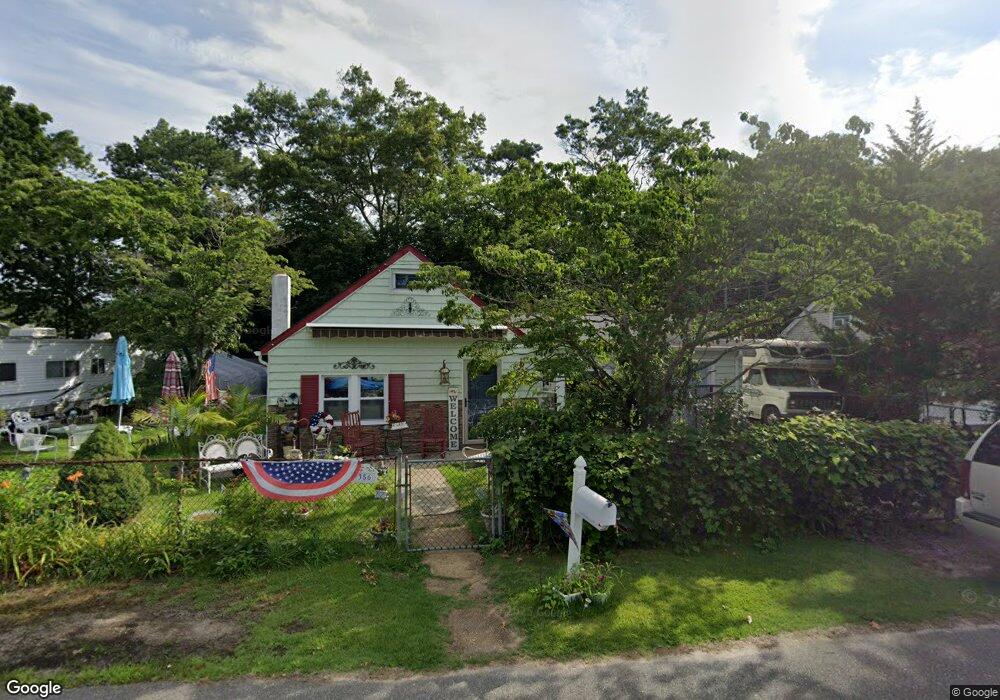
356 Cahill Rd Toms River, NJ 08755
Estimated Value: $281,000 - $476,000
2
Beds
2
Baths
1,369
Sq Ft
$256/Sq Ft
Est. Value
About This Home
This home is located at 356 Cahill Rd, Toms River, NJ 08755 and is currently estimated at $349,840, approximately $255 per square foot. 356 Cahill Rd is a home located in Ocean County with nearby schools including St Joseph Grade School, Ambassador Christian Academy, and Donovan Catholic High School.
Ownership History
Date
Name
Owned For
Owner Type
Purchase Details
Closed on
Aug 4, 2023
Sold by
Haak Cynthia E
Bought by
Haak Cynthia E and Hoover Eduardo
Current Estimated Value
Purchase Details
Closed on
Apr 20, 2003
Sold by
Haak Cynthia E
Bought by
Haak Cynthia E
Home Financials for this Owner
Home Financials are based on the most recent Mortgage that was taken out on this home.
Original Mortgage
$89,800
Interest Rate
5.53%
Purchase Details
Closed on
Jun 10, 1998
Sold by
Glickstein Jeff S
Bought by
Haak Cynthia E and Haak Alexander
Purchase Details
Closed on
Jun 30, 1995
Sold by
Hansen Edel
Bought by
Haak Cynthia and Glickstein Jeff
Home Financials for this Owner
Home Financials are based on the most recent Mortgage that was taken out on this home.
Original Mortgage
$74,000
Interest Rate
7.49%
Mortgage Type
FHA
Create a Home Valuation Report for This Property
The Home Valuation Report is an in-depth analysis detailing your home's value as well as a comparison with similar homes in the area
Home Values in the Area
Average Home Value in this Area
Purchase History
| Date | Buyer | Sale Price | Title Company |
|---|---|---|---|
| Haak Cynthia E | -- | None Listed On Document | |
| Haak Cynthia E | -- | -- | |
| Haak Cynthia E | -- | -- | |
| Haak Cynthia | $75,750 | -- |
Source: Public Records
Mortgage History
| Date | Status | Borrower | Loan Amount |
|---|---|---|---|
| Previous Owner | Haak Cynthia E | $89,800 | |
| Previous Owner | Haak Cynthia | $74,000 |
Source: Public Records
Tax History Compared to Growth
Tax History
| Year | Tax Paid | Tax Assessment Tax Assessment Total Assessment is a certain percentage of the fair market value that is determined by local assessors to be the total taxable value of land and additions on the property. | Land | Improvement |
|---|---|---|---|---|
| 2025 | $4,350 | $238,900 | $144,000 | $94,900 |
| 2024 | $3,885 | $238,900 | $144,000 | $94,900 |
| 2023 | $3,987 | $238,900 | $144,000 | $94,900 |
| 2022 | $3,987 | $238,900 | $144,000 | $94,900 |
| 2021 | $4,284 | $171,000 | $92,300 | $78,700 |
| 2020 | $4,265 | $171,000 | $92,300 | $78,700 |
| 2019 | $4,080 | $171,000 | $92,300 | $78,700 |
| 2018 | $4,025 | $171,000 | $92,300 | $78,700 |
| 2017 | $3,991 | $171,000 | $92,300 | $78,700 |
| 2016 | $3,887 | $171,000 | $92,300 | $78,700 |
| 2015 | $3,740 | $171,000 | $92,300 | $78,700 |
| 2014 | $3,560 | $171,000 | $92,300 | $78,700 |
Source: Public Records
Map
Nearby Homes