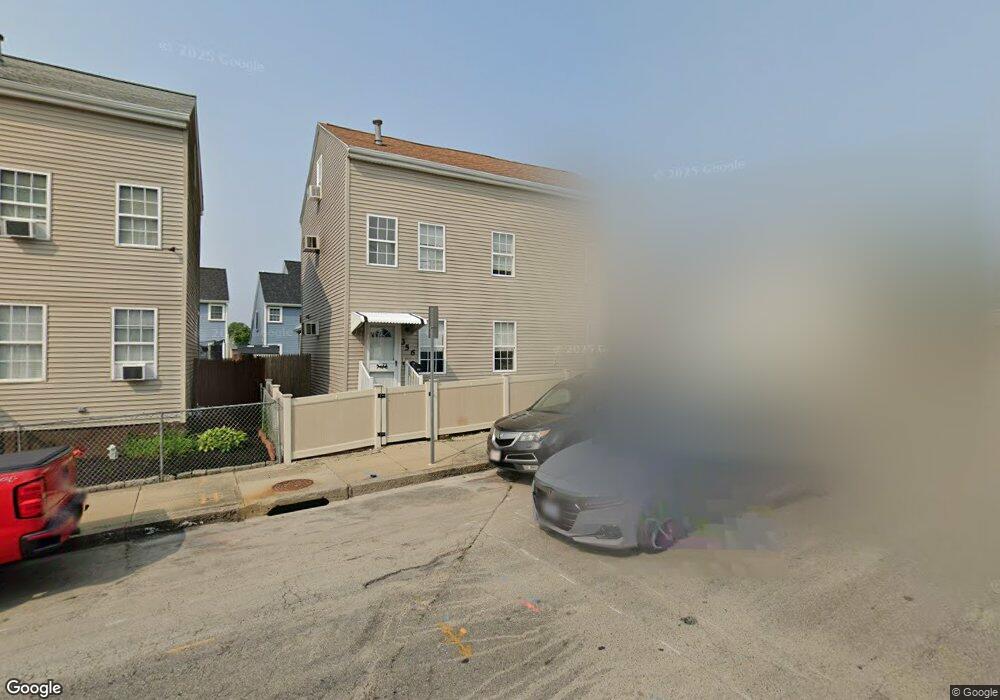
356 Globe St Fall River, MA 02724
Sandy Beach NeighborhoodEstimated Value: $412,834 - $455,000
3
Beds
2
Baths
1,884
Sq Ft
$228/Sq Ft
Est. Value
About This Home
This home is located at 356 Globe St, Fall River, MA 02724 and is currently estimated at $430,209, approximately $228 per square foot. 356 Globe St is a home located in Bristol County with nearby schools including Carlton M. Viveiros Elementary School, Matthew J. Kuss Middle School, and B M C Durfee High School.
Ownership History
Date
Name
Owned For
Owner Type
Purchase Details
Closed on
Aug 8, 2025
Sold by
Lomas Christine M Est and Moniz
Bought by
Moniz Kayla and Kuzner Jonathan
Current Estimated Value
Purchase Details
Closed on
Jul 3, 2021
Sold by
Kuzner John
Bought by
Moniz Kayla A
Purchase Details
Closed on
Jun 30, 2008
Sold by
Us Bk
Bought by
Lomas Christine and Kuznar John
Home Financials for this Owner
Home Financials are based on the most recent Mortgage that was taken out on this home.
Original Mortgage
$177,219
Interest Rate
6.07%
Mortgage Type
Purchase Money Mortgage
Purchase Details
Closed on
May 2, 2008
Sold by
Tavares Ramisi and Tavares Fernando
Bought by
Us Bk
Home Financials for this Owner
Home Financials are based on the most recent Mortgage that was taken out on this home.
Original Mortgage
$177,219
Interest Rate
6.07%
Mortgage Type
Purchase Money Mortgage
Purchase Details
Closed on
Sep 12, 2002
Sold by
Mercer Christopher and Mercer Valerie
Bought by
Carvalho Joaquin
Purchase Details
Closed on
May 21, 2001
Sold by
Pedro Antonio D and Pedro Ilda
Bought by
Mercer Christopher and Mercer Valerie
Purchase Details
Closed on
Jun 3, 1996
Sold by
Dacruz Joao C and Dacruz Dalila
Bought by
Pedro Antonio D and Pedro Ilda
Create a Home Valuation Report for This Property
The Home Valuation Report is an in-depth analysis detailing your home's value as well as a comparison with similar homes in the area
Home Values in the Area
Average Home Value in this Area
Purchase History
| Date | Buyer | Sale Price | Title Company |
|---|---|---|---|
| Moniz Kayla | -- | -- | |
| Moniz Kayla | -- | -- | |
| Moniz Kayla A | -- | None Available | |
| Moniz Kayla A | -- | None Available | |
| Lomas Christine | $180,000 | -- | |
| Lomas Christine | $180,000 | -- | |
| Us Bk | $174,250 | -- | |
| Us Bk | $174,250 | -- | |
| Carvalho Joaquin | $189,900 | -- | |
| Carvalho Joaquin | $189,900 | -- | |
| Mercer Christopher | $134,900 | -- | |
| Mercer Christopher | $134,900 | -- | |
| Pedro Antonio D | $109,900 | -- | |
| Pedro Antonio D | $109,900 | -- |
Source: Public Records
Mortgage History
| Date | Status | Borrower | Loan Amount |
|---|---|---|---|
| Previous Owner | Pedro Antonio D | $179,858 | |
| Previous Owner | Lomas Christine | $177,219 |
Source: Public Records
Tax History
| Year | Tax Paid | Tax Assessment Tax Assessment Total Assessment is a certain percentage of the fair market value that is determined by local assessors to be the total taxable value of land and additions on the property. | Land | Improvement |
|---|---|---|---|---|
| 2025 | $3,776 | $329,800 | $106,400 | $223,400 |
| 2024 | $3,653 | $317,900 | $102,500 | $215,400 |
| 2023 | $3,378 | $275,300 | $84,700 | $190,600 |
| 2022 | $3,007 | $238,300 | $80,600 | $157,700 |
| 2021 | $2,928 | $211,700 | $76,700 | $135,000 |
| 2020 | $2,916 | $201,800 | $75,600 | $126,200 |
| 2019 | $2,826 | $193,800 | $72,800 | $121,000 |
| 2018 | $2,950 | $201,800 | $78,800 | $123,000 |
| 2017 | $2,743 | $195,900 | $75,200 | $120,700 |
| 2016 | $2,636 | $193,400 | $80,000 | $113,400 |
| 2015 | $2,530 | $193,400 | $80,000 | $113,400 |
| 2014 | $2,403 | $191,000 | $77,600 | $113,400 |
Source: Public Records
Map
Nearby Homes
- 20 Wilcox St
- 1334 S Main St
- 1273-1279 S Main St
- 234 Kilburn St
- 464 Birch St
- 917 Dwelly St
- 70 Brown St
- 344-354 E Main St
- 609 King Philip St
- 1846 S Main St
- 1852 S Main St
- 219 Montaup St
- 71 Mystic St Unit 3
- 240 Montaup St
- 82 Montaup St
- 245 Dwelly St
- 57 Larouche St
- 15 Higgins St
- 340 Vale St
- 355 Peckham St
Your Personal Tour Guide
Ask me questions while you tour the home.