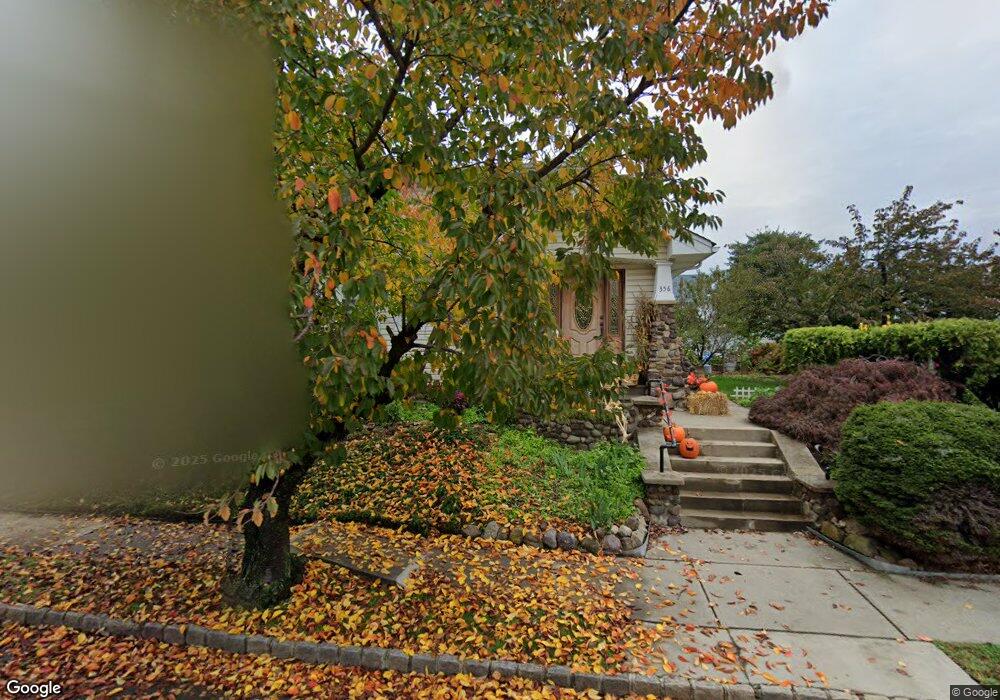
356 Little St Belleville, NJ 07109
Estimated Value: $584,000 - $678,000
--
Bed
--
Bath
2,299
Sq Ft
$268/Sq Ft
Est. Value
About This Home
This home is located at 356 Little St, Belleville, NJ 07109 and is currently estimated at $616,398, approximately $268 per square foot. 356 Little St is a home located in Essex County with nearby schools including Belleville High School, Good Shepherd Academy, and St. Peter Elementary School.
Ownership History
Date
Name
Owned For
Owner Type
Purchase Details
Closed on
Dec 23, 2005
Sold by
Aaam Investments Llc
Bought by
Martinez Anthony
Current Estimated Value
Home Financials for this Owner
Home Financials are based on the most recent Mortgage that was taken out on this home.
Original Mortgage
$280,000
Outstanding Balance
$144,430
Interest Rate
5%
Mortgage Type
Adjustable Rate Mortgage/ARM
Estimated Equity
$471,968
Purchase Details
Closed on
Feb 10, 1998
Sold by
Graham Winifred
Bought by
Elhelou Mohamed and Elhelou Jasminka
Create a Home Valuation Report for This Property
The Home Valuation Report is an in-depth analysis detailing your home's value as well as a comparison with similar homes in the area
Home Values in the Area
Average Home Value in this Area
Purchase History
| Date | Buyer | Sale Price | Title Company |
|---|---|---|---|
| Martinez Anthony | $350,000 | -- | |
| Elhelou Mohamed | $120,000 | -- |
Source: Public Records
Mortgage History
| Date | Status | Borrower | Loan Amount |
|---|---|---|---|
| Open | Martinez Anthony | $280,000 |
Source: Public Records
Tax History Compared to Growth
Tax History
| Year | Tax Paid | Tax Assessment Tax Assessment Total Assessment is a certain percentage of the fair market value that is determined by local assessors to be the total taxable value of land and additions on the property. | Land | Improvement |
|---|---|---|---|---|
| 2025 | $14,180 | $362,300 | $187,500 | $174,800 |
| 2024 | $14,180 | $362,300 | $187,500 | $174,800 |
| 2022 | $13,952 | $362,300 | $187,500 | $174,800 |
| 2021 | $14,888 | $392,300 | $187,500 | $204,800 |
| 2020 | $14,684 | $392,300 | $187,500 | $204,800 |
| 2019 | $13,891 | $392,300 | $187,500 | $204,800 |
| 2018 | $12,636 | $315,100 | $177,500 | $137,600 |
| 2017 | $12,216 | $315,100 | $177,500 | $137,600 |
| 2016 | $12,081 | $315,100 | $177,500 | $137,600 |
| 2015 | $11,671 | $315,100 | $177,500 | $137,600 |
| 2014 | $11,359 | $315,100 | $177,500 | $137,600 |
Source: Public Records
Map
Nearby Homes