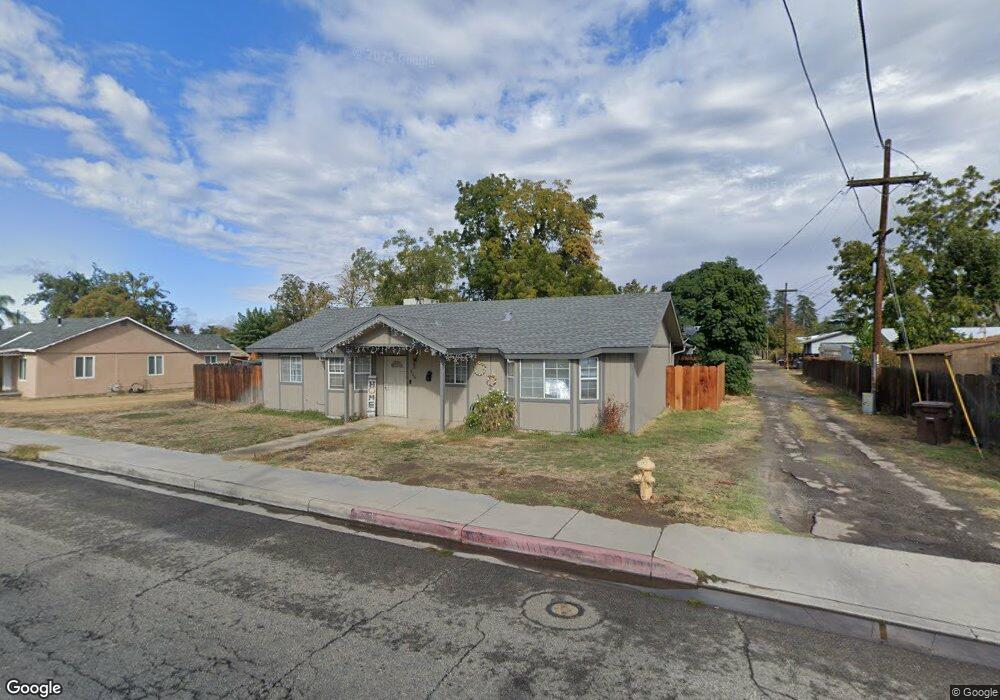
356 N 15th St Chowchilla, CA 93610
Estimated Value: $292,000 - $329,945
3
Beds
2
Baths
1,461
Sq Ft
$215/Sq Ft
Est. Value
About This Home
This home is located at 356 N 15th St, Chowchilla, CA 93610 and is currently estimated at $313,486, approximately $214 per square foot. 356 N 15th St is a home located in Madera County with nearby schools including Merle L. Fuller Elementary School, Stephens Elementary School, and Ronald Reagan Elementary School.
Ownership History
Date
Name
Owned For
Owner Type
Purchase Details
Closed on
Oct 5, 2018
Sold by
Allen Tommy D
Bought by
Allen Tommy D
Current Estimated Value
Purchase Details
Closed on
Feb 22, 2012
Sold by
Secretary Of Housing & Urban Development
Bought by
Allen Tommy D
Home Financials for this Owner
Home Financials are based on the most recent Mortgage that was taken out on this home.
Original Mortgage
$42,000
Outstanding Balance
$28,705
Interest Rate
3.84%
Mortgage Type
New Conventional
Estimated Equity
$284,781
Purchase Details
Closed on
Aug 9, 2011
Sold by
Flagstar Bank Fsb
Bought by
United States Department Of Housing & Ur
Purchase Details
Closed on
Mar 22, 2011
Sold by
Ramos Crisanto Flores and Ramos Olivia S
Bought by
Flagstar Bank Fsb
Purchase Details
Closed on
Aug 29, 2008
Sold by
Ramos Crisanto Flores and Ramos Olivia S
Bought by
Ramos Crisanto Flores and Ramos Olivia S
Create a Home Valuation Report for This Property
The Home Valuation Report is an in-depth analysis detailing your home's value as well as a comparison with similar homes in the area
Home Values in the Area
Average Home Value in this Area
Purchase History
| Date | Buyer | Sale Price | Title Company |
|---|---|---|---|
| Allen Tommy D | -- | None Available | |
| Allen Tommy D | $66,000 | Chicago Title Company | |
| United States Department Of Housing & Ur | -- | First American Title Company | |
| Flagstar Bank Fsb | $146,827 | First American Title | |
| Ramos Crisanto Flores | -- | Multiple |
Source: Public Records
Mortgage History
| Date | Status | Borrower | Loan Amount |
|---|---|---|---|
| Open | Allen Tommy D | $42,000 |
Source: Public Records
Tax History Compared to Growth
Tax History
| Year | Tax Paid | Tax Assessment Tax Assessment Total Assessment is a certain percentage of the fair market value that is determined by local assessors to be the total taxable value of land and additions on the property. | Land | Improvement |
|---|---|---|---|---|
| 2025 | $885 | $82,764 | $18,837 | $63,927 |
| 2023 | $885 | $79,552 | $18,106 | $61,446 |
| 2022 | $827 | $77,993 | $17,751 | $60,242 |
| 2021 | $816 | $76,464 | $17,403 | $59,061 |
| 2020 | $795 | $75,681 | $17,225 | $58,456 |
| 2019 | $788 | $74,198 | $16,888 | $57,310 |
| 2018 | $770 | $72,744 | $16,557 | $56,187 |
| 2017 | $758 | $71,319 | $16,233 | $55,086 |
| 2016 | $722 | $69,921 | $15,915 | $54,006 |
| 2015 | $713 | $68,871 | $15,676 | $53,195 |
| 2014 | $700 | $67,522 | $15,369 | $52,153 |
Source: Public Records
Map
Nearby Homes
- 1404 Trinity Ave
- 1550 W Robertson Blvd Unit 1520
- 1550 W Robertson Blvd
- 1017 Kings Ave
- 1112 Sonoma Ave
- 105 Cedar Ct
- 41-47 Robertson Blvd
- 1604 Parkridge Dr
- 881 Gill Way
- 1105 Orange Ave
- 801 Riverside Ave
- 817 Sonoma Ave
- 1 Adams Dr
- 428 Oleander Dr
- 1209 Alameda Ave
- 509 Adams Dr
- 809 Orange Ave
- 801 Orange Ave
- 424 Washington Dr
- 521 Adams Dr
- 360 N 15th St
- 1415 Lake Ave
- 350 N 15th St
- 1409 Lake Ave
- 1412 Riverside Ave
- 1420 Riverside Ave
- 331 N 15th St
- 1408 Riverside Ave
- 1405 Lake Ave
- 325 N 15th St
- 345 N 15th St
- 410 N 15th St
- 1404 Riverside Ave
- 315 N 15th St
- 335 N 14th St
- 1412 Lake Ave
- 305 N 15th St
- 1400 Riverside Ave
- 365 N 15th St
- 1408 Lake Ave