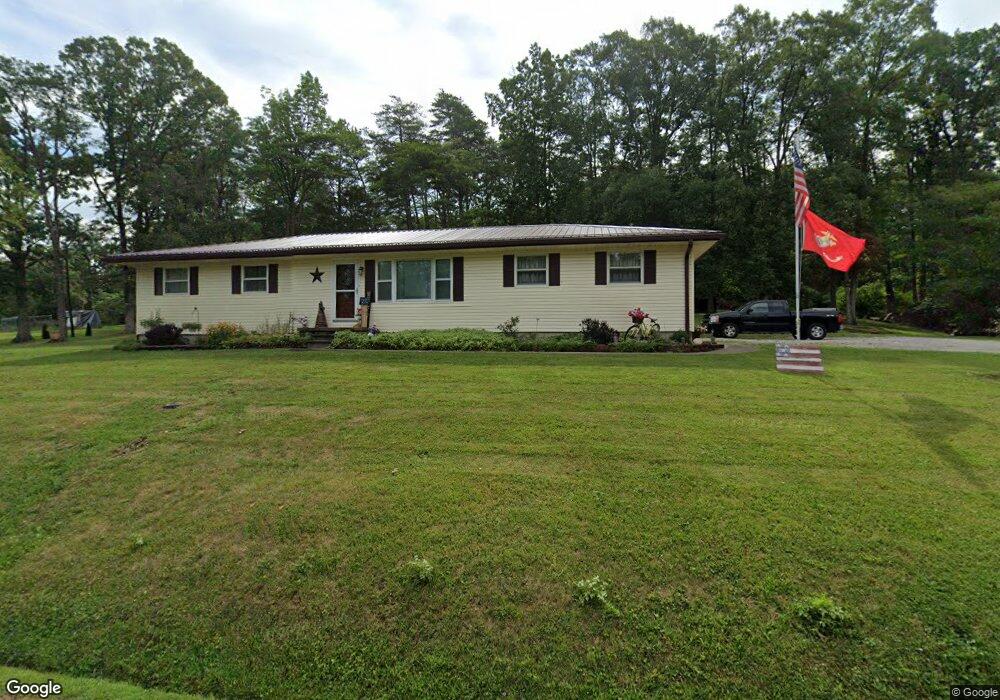
356 Nehus Rd West Union, OH 45693
Estimated Value: $132,000 - $208,000
3
Beds
2
Baths
988
Sq Ft
$166/Sq Ft
Est. Value
About This Home
This home is located at 356 Nehus Rd, West Union, OH 45693 and is currently estimated at $164,057, approximately $166 per square foot. 356 Nehus Rd is a home located in Adams County with nearby schools including West Union Elementary School, West Union High School, and Adams County Christian School.
Ownership History
Date
Name
Owned For
Owner Type
Purchase Details
Closed on
Oct 10, 2023
Sold by
Barnes Mark
Bought by
Board Of Trustees Of Tiffin Township
Current Estimated Value
Purchase Details
Closed on
Sep 16, 2011
Sold by
Poarch Aron and Roush Daniele L
Bought by
Roush John S and Roush Brenda L
Home Financials for this Owner
Home Financials are based on the most recent Mortgage that was taken out on this home.
Original Mortgage
$55,000
Interest Rate
4.4%
Mortgage Type
FHA
Purchase Details
Closed on
Jul 14, 2005
Sold by
Campbell Corey P and Campbell Candy M
Bought by
Poarch Aron and Roush Daniele L
Home Financials for this Owner
Home Financials are based on the most recent Mortgage that was taken out on this home.
Original Mortgage
$67,500
Interest Rate
5.69%
Mortgage Type
Purchase Money Mortgage
Purchase Details
Closed on
Jun 24, 2002
Sold by
Redmon Tyra Ray
Bought by
Campbell Corey P
Purchase Details
Closed on
Feb 8, 1996
Bought by
Redmon Tyra Ray
Create a Home Valuation Report for This Property
The Home Valuation Report is an in-depth analysis detailing your home's value as well as a comparison with similar homes in the area
Purchase History
| Date | Buyer | Sale Price | Title Company |
|---|---|---|---|
| Board Of Trustees Of Tiffin Township | -- | None Listed On Document | |
| Board Of Trustees Of Tiffin Township | -- | None Listed On Document | |
| Roush John S | $75,000 | None Available | |
| Poarch Aron | $75,000 | None Available | |
| Campbell Corey P | $79,000 | -- | |
| Redmon Tyra Ray | $53,000 | -- |
Source: Public Records
Mortgage History
| Date | Status | Borrower | Loan Amount |
|---|---|---|---|
| Previous Owner | Roush John S | $55,000 | |
| Previous Owner | Poarch Aron | $67,500 |
Source: Public Records
Tax History
| Year | Tax Paid | Tax Assessment Tax Assessment Total Assessment is a certain percentage of the fair market value that is determined by local assessors to be the total taxable value of land and additions on the property. | Land | Improvement |
|---|---|---|---|---|
| 2025 | $1,163 | $34,270 | $4,060 | $30,210 |
| 2024 | $582 | $34,270 | $4,060 | $30,210 |
| 2023 | $586 | $34,270 | $4,060 | $30,210 |
| 2022 | $1,162 | $27,800 | $2,910 | $24,890 |
| 2021 | $1,022 | $27,800 | $2,910 | $24,890 |
| 2020 | $1,045 | $27,800 | $2,910 | $24,890 |
| 2019 | $1,045 | $27,800 | $2,910 | $24,890 |
| 2018 | $905 | $24,540 | $2,910 | $21,630 |
| 2017 | $890 | $24,540 | $2,910 | $21,630 |
| 2016 | $444 | $24,540 | $2,910 | $21,630 |
| 2015 | $858 | $24,510 | $2,980 | $21,530 |
| 2014 | $858 | $24,510 | $2,980 | $21,530 |
Source: Public Records
Map
Nearby Homes
- 4400 Chapparal Rd
- 247 Madonna Dr
- 80 Madonna Dr
- 175 Paula Dr
- 70 Logans Ln
- 305 W Walnut St
- 408 W South St
- 0.8ac State Route 41
- 12196 State Route 41
- 0 State Route 41 1 Acre Lot
- 166 Rigdon Rd
- 315 E North St
- 917 Logans Ln
- 104 N Washington St
- 286 & 290 S Market St
- 3315 Chapparal Rd
- 435 Rolling Woods Dr
- 215 Chesley St
- 5768 Ohio 125
- 9727 Ohio 125
Your Personal Tour Guide
Ask me questions while you tour the home.