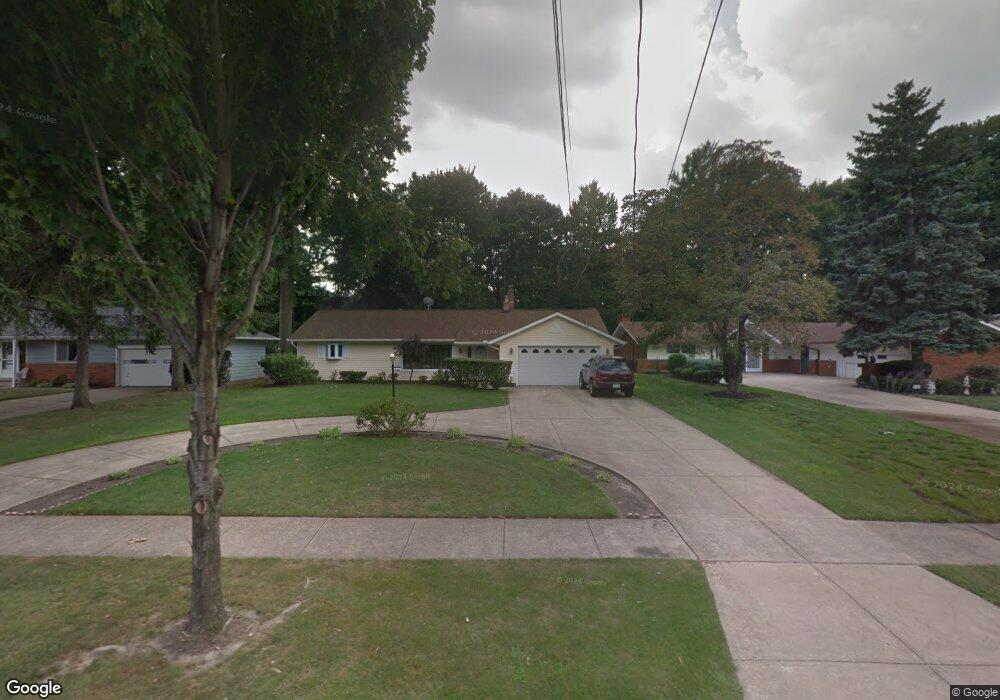
356 Royal Oak Blvd Cleveland, OH 44143
Estimated Value: $230,000 - $259,000
3
Beds
2
Baths
2,056
Sq Ft
$119/Sq Ft
Est. Value
About This Home
This home is located at 356 Royal Oak Blvd, Cleveland, OH 44143 and is currently estimated at $244,724, approximately $119 per square foot. 356 Royal Oak Blvd is a home located in Cuyahoga County with nearby schools including Richmond Heights Elementary School, Richmond Heights Secondary School, and Flex High School Cleveland.
Ownership History
Date
Name
Owned For
Owner Type
Purchase Details
Closed on
Mar 7, 2022
Sold by
Studmire and Maxine
Bought by
Studmire Living Trust
Current Estimated Value
Purchase Details
Closed on
Sep 13, 1993
Sold by
Reinker Marilyn A
Bought by
Studmire Robert L
Purchase Details
Closed on
Aug 12, 1992
Sold by
Reinker Robert J and Reinker Marilyn A
Bought by
Reinker Marilyn A
Purchase Details
Closed on
Apr 15, 1987
Sold by
Allega John
Bought by
Reinker Robert J and Reinker Marilyn A
Purchase Details
Closed on
Mar 23, 1987
Sold by
Allega John and Allega Marilyn J
Bought by
Allega John
Purchase Details
Closed on
Aug 18, 1982
Sold by
Hoye Richard J
Bought by
Allega John and Allega Marilyn J
Purchase Details
Closed on
Jun 18, 1976
Sold by
Turner Fred E and Turner Sylvia A
Bought by
Hoye Richard J
Purchase Details
Closed on
Jan 1, 1975
Bought by
Turner Fred E and Turner Sylvia A
Create a Home Valuation Report for This Property
The Home Valuation Report is an in-depth analysis detailing your home's value as well as a comparison with similar homes in the area
Home Values in the Area
Average Home Value in this Area
Purchase History
| Date | Buyer | Sale Price | Title Company |
|---|---|---|---|
| Studmire Living Trust | -- | Siegel Neil W | |
| Studmire Robert L | $132,000 | -- | |
| Reinker Marilyn A | -- | -- | |
| Reinker Robert J | $100,000 | -- | |
| Allega John | -- | -- | |
| Allega John | -- | -- | |
| Hoye Richard J | $54,000 | -- | |
| Turner Fred E | -- | -- |
Source: Public Records
Tax History Compared to Growth
Tax History
| Year | Tax Paid | Tax Assessment Tax Assessment Total Assessment is a certain percentage of the fair market value that is determined by local assessors to be the total taxable value of land and additions on the property. | Land | Improvement |
|---|---|---|---|---|
| 2024 | $4,655 | $71,575 | $14,560 | $57,015 |
| 2023 | $5,558 | $60,490 | $10,540 | $49,950 |
| 2022 | $4,655 | $60,200 | $10,540 | $49,670 |
| 2021 | $4,633 | $60,200 | $10,540 | $49,670 |
| 2020 | $4,024 | $49,350 | $8,650 | $40,710 |
| 2019 | $3,963 | $141,000 | $24,700 | $116,300 |
| 2018 | $3,797 | $49,350 | $8,650 | $40,710 |
| 2017 | $4,199 | $50,260 | $8,540 | $41,720 |
| 2016 | $3,668 | $50,260 | $8,540 | $41,720 |
| 2015 | $3,564 | $50,260 | $8,540 | $41,720 |
| 2014 | $3,564 | $49,290 | $8,370 | $40,920 |
Source: Public Records
Map
Nearby Homes
- 341 Knollwood Trail
- 321 Royal Oak Blvd
- 24720 Dundee Dr
- 4894 Nan Linn Dr
- 2093 Newcome St
- 1765 E 238th St
- 470 Celestia Dr
- 24120 Glenbrook Blvd
- 1983 Idlehurst Dr
- 467 Harris Rd
- 1940 Skyline Dr
- 2075 E 226th St
- 22601 Harms Rd
- 1997 E 226th St
- 1864 Glen Oval
- 24801 Highland Rd
- 2084 E 224th St
- 23785 Greenwood Rd
- 509 Forsythia Ln
- 22151 Hadden Rd
- 358 Royal Oak Blvd
- 354 Royal Oak Blvd
- 360 Royal Oak Blvd
- 352 Royal Oak Blvd
- 359 Claymore Blvd
- 357 Claymore Blvd
- 361 Claymore Blvd
- 362 Royal Oak Blvd
- 350 Royal Oak Blvd
- 355 Claymore Blvd
- 355 Royal Oak Blvd
- 357 Royal Oak Blvd
- 359 Royal Oak Blvd
- 363 Claymore Blvd
- 353 Royal Oak Blvd
- 361 Royal Oak Blvd
- 364 Royal Oak Blvd
- 353 Claymore Blvd
- 348 Royal Oak Blvd
- 351 Royal Oak Blvd