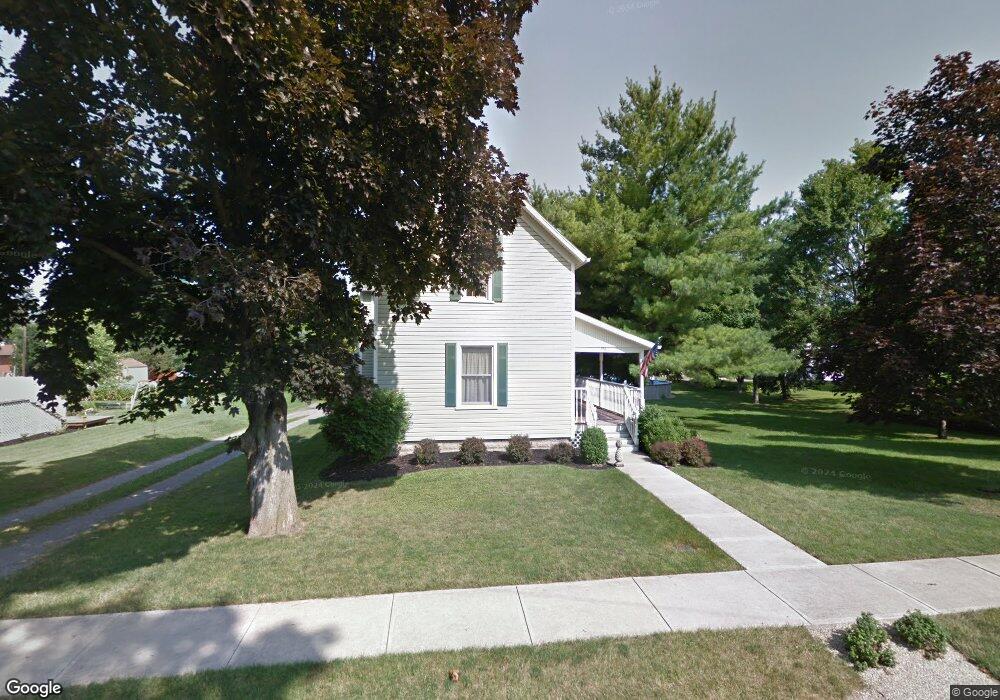
356 S Jackson St Bluffton, OH 45817
Estimated Value: $286,000 - $329,000
4
Beds
2
Baths
2,188
Sq Ft
$138/Sq Ft
Est. Value
About This Home
This home is located at 356 S Jackson St, Bluffton, OH 45817 and is currently estimated at $303,025, approximately $138 per square foot. 356 S Jackson St is a home located in Allen County with nearby schools including Bluffton Elementary School, Bluffton Middle School, and Bluffton High School.
Ownership History
Date
Name
Owned For
Owner Type
Purchase Details
Closed on
Nov 3, 2006
Sold by
Steiner Jesse D and Steiner Christa K
Bought by
Mittendorf Steven and Mittendorf Allison
Current Estimated Value
Home Financials for this Owner
Home Financials are based on the most recent Mortgage that was taken out on this home.
Original Mortgage
$134,400
Outstanding Balance
$13,426
Interest Rate
6.45%
Mortgage Type
New Conventional
Estimated Equity
$289,599
Purchase Details
Closed on
Jun 25, 1996
Sold by
Badertscher Dean
Bought by
Kennell Jerry and Kennell Leonor
Home Financials for this Owner
Home Financials are based on the most recent Mortgage that was taken out on this home.
Original Mortgage
$96,000
Interest Rate
8.29%
Mortgage Type
New Conventional
Purchase Details
Closed on
Jul 13, 1990
Bought by
Badertscher Dean R
Create a Home Valuation Report for This Property
The Home Valuation Report is an in-depth analysis detailing your home's value as well as a comparison with similar homes in the area
Home Values in the Area
Average Home Value in this Area
Purchase History
| Date | Buyer | Sale Price | Title Company |
|---|---|---|---|
| Mittendorf Steven | $168,000 | None Available | |
| Kennell Jerry | $120,000 | -- | |
| Badertscher Dean R | $40,000 | -- |
Source: Public Records
Mortgage History
| Date | Status | Borrower | Loan Amount |
|---|---|---|---|
| Open | Mittendorf Steven | $134,400 | |
| Previous Owner | Kennell Jerry | $96,000 |
Source: Public Records
Tax History
| Year | Tax Paid | Tax Assessment Tax Assessment Total Assessment is a certain percentage of the fair market value that is determined by local assessors to be the total taxable value of land and additions on the property. | Land | Improvement |
|---|---|---|---|---|
| 2024 | $2,725 | $82,530 | $18,970 | $63,560 |
| 2023 | $2,450 | $68,780 | $15,820 | $52,960 |
| 2022 | $2,475 | $68,780 | $15,820 | $52,960 |
| 2021 | $2,492 | $68,780 | $15,820 | $52,960 |
| 2020 | $2,388 | $59,570 | $15,120 | $44,450 |
| 2019 | $2,388 | $59,570 | $15,120 | $44,450 |
| 2018 | $2,249 | $59,570 | $15,120 | $44,450 |
| 2017 | $2,100 | $52,150 | $15,120 | $37,030 |
| 2016 | $2,061 | $50,960 | $13,930 | $37,030 |
| 2015 | $2,024 | $50,960 | $13,930 | $37,030 |
| 2014 | $2,024 | $48,510 | $13,510 | $35,000 |
| 2013 | $1,875 | $48,510 | $13,510 | $35,000 |
Source: Public Records
Map
Nearby Homes
- 218 S Jackson St
- 307 S Main St Unit back
- 513 S Jackson St
- 303 Parkview Dr
- 305 Parkview Dr
- 301 Parkview Dr
- 307 Parkview Dr
- 315 Parkview Dr
- 0 Columbus Grove-Bluffton Rd
- 317 Parkview Dr
- 319 Parkview Dr
- 160 Chestnut Ln
- 321 Parkview Dr
- 327 Parkview Dr
- 329 Parkview Dr
- 331 Parkview Dr
- 222 N Lawn Ave
- 333 Parkview Dr
- 0 Ohio 103
- 210 N Jackson St
- 346 S Jackson St
- 360 S Jackson St
- 340 S Jackson St
- 269 S Lawn Ave
- 334 S Jackson St
- 263 S Lawn Ave
- 363 S Jackson St
- 291 S Lawn Ave
- 257 S Lawn Ave
- 357 S Jackson St
- 365 S Jackson St
- 368 S Jackson St
- 142 W Kibler St
- 349 S Jackson St
- 330 S Jackson St
- 144 W Kibler St
- 251 S Lawn Ave
- 251 S Lawn Ave
- 295 S Lawn Ave
- 339 S Jackson St
Your Personal Tour Guide
Ask me questions while you tour the home.