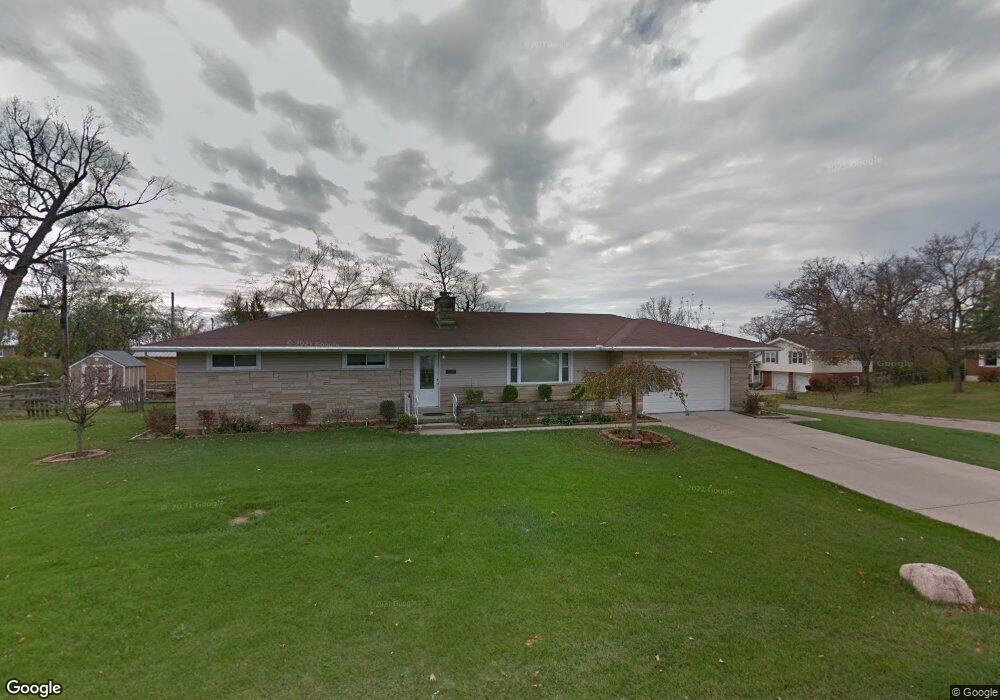
356 Tritt Ln Fairborn, OH 45324
Estimated Value: $230,000 - $259,000
4
Beds
2
Baths
1,378
Sq Ft
$175/Sq Ft
Est. Value
About This Home
This home is located at 356 Tritt Ln, Fairborn, OH 45324 and is currently estimated at $240,953, approximately $174 per square foot. 356 Tritt Ln is a home located in Greene County with nearby schools including Fairborn Primary School, Fairborn Intermediate School, and Fairborn Middle School.
Ownership History
Date
Name
Owned For
Owner Type
Purchase Details
Closed on
Jul 23, 2019
Sold by
Do Vanna and Vo Steven
Bought by
Henault Zachary Robert
Current Estimated Value
Home Financials for this Owner
Home Financials are based on the most recent Mortgage that was taken out on this home.
Original Mortgage
$163,833
Outstanding Balance
$141,918
Interest Rate
3.8%
Mortgage Type
New Conventional
Estimated Equity
$99,035
Purchase Details
Closed on
Aug 3, 2004
Sold by
Bryant Christine M and Bryant Alan B
Bought by
Do Vanna
Home Financials for this Owner
Home Financials are based on the most recent Mortgage that was taken out on this home.
Original Mortgage
$125,100
Interest Rate
7.5%
Mortgage Type
Unknown
Purchase Details
Closed on
Jul 25, 2000
Sold by
Heritage Investment Trust 1228
Bought by
Bryant Alan B and Bryant Christine M
Home Financials for this Owner
Home Financials are based on the most recent Mortgage that was taken out on this home.
Original Mortgage
$122,298
Interest Rate
8.19%
Mortgage Type
VA
Create a Home Valuation Report for This Property
The Home Valuation Report is an in-depth analysis detailing your home's value as well as a comparison with similar homes in the area
Home Values in the Area
Average Home Value in this Area
Purchase History
| Date | Buyer | Sale Price | Title Company |
|---|---|---|---|
| Henault Zachary Robert | $168,900 | None Available | |
| Do Vanna | $139,000 | Hallmark Title | |
| Bryant Alan B | $119,900 | -- |
Source: Public Records
Mortgage History
| Date | Status | Borrower | Loan Amount |
|---|---|---|---|
| Open | Henault Zachary Robert | $163,833 | |
| Previous Owner | Do Vanna | $125,100 | |
| Previous Owner | Bryant Alan B | $122,298 |
Source: Public Records
Tax History
| Year | Tax Paid | Tax Assessment Tax Assessment Total Assessment is a certain percentage of the fair market value that is determined by local assessors to be the total taxable value of land and additions on the property. | Land | Improvement |
|---|---|---|---|---|
| 2025 | $3,361 | $69,660 | $9,970 | $59,690 |
| 2024 | $3,361 | $69,660 | $9,970 | $59,690 |
| 2023 | $3,336 | $69,660 | $9,970 | $59,690 |
| 2022 | $3,163 | $55,610 | $7,120 | $48,490 |
| 2021 | $3,210 | $55,610 | $7,120 | $48,490 |
| 2020 | $3,227 | $55,610 | $7,120 | $48,490 |
| 2019 | $2,225 | $38,390 | $6,910 | $31,480 |
| 2018 | $2,249 | $38,390 | $6,910 | $31,480 |
| 2017 | $2,249 | $38,390 | $6,910 | $31,480 |
| 2016 | $2,250 | $38,390 | $6,910 | $31,480 |
| 2015 | $2,145 | $38,390 | $6,910 | $31,480 |
| 2014 | $2,075 | $38,390 | $6,910 | $31,480 |
Source: Public Records
Map
Nearby Homes
- 1222 Oakhill Ave
- 827 Mitman Dr
- 801-803 Winston Dr
- 621 June Dr
- 303 E Whittier Ave
- 711 N Central Ave
- 313 Archer Dr
- 261 Archer Dr
- 000 Morris Dr
- 388-390 Morris Dr Unit 388
- 323 Mann Ave
- 112 Mann Ave
- 308 E Xenia Dr
- 112 E Xenia Dr
- 226-230 N Broad St
- 139 Hower Ln
- 10796 Haddix Rd
- 1221 Harmony Ln
- 1040 Baywood Dr
- 625 Sharon Dr
- 1197 Peebles Dr
- 370 Tritt Ln
- 1308 Sunset Dr
- 1229 Sunset Dr
- 1219 Sunset Dr
- 1309 Eastview Dr
- 1198 Peebles Dr
- 1307 Sunset Dr
- 1201 Sunset Dr
- 1196 Peebles Dr
- 1315 Eastview Dr
- 1322 Sunset Dr
- 1194 Peebles Dr
- 382 Tritt Ln
- 1189 Peebles Dr
- 1319 Sunset Dr
- 1220 Davis Dr
- 1226 Davis Dr
- 1192 Peebles Dr
- 1216 Davis Dr
Your Personal Tour Guide
Ask me questions while you tour the home.