356 W 11th Ave Oshkosh, WI 54902
Estimated payment $1,068/month
About This Home
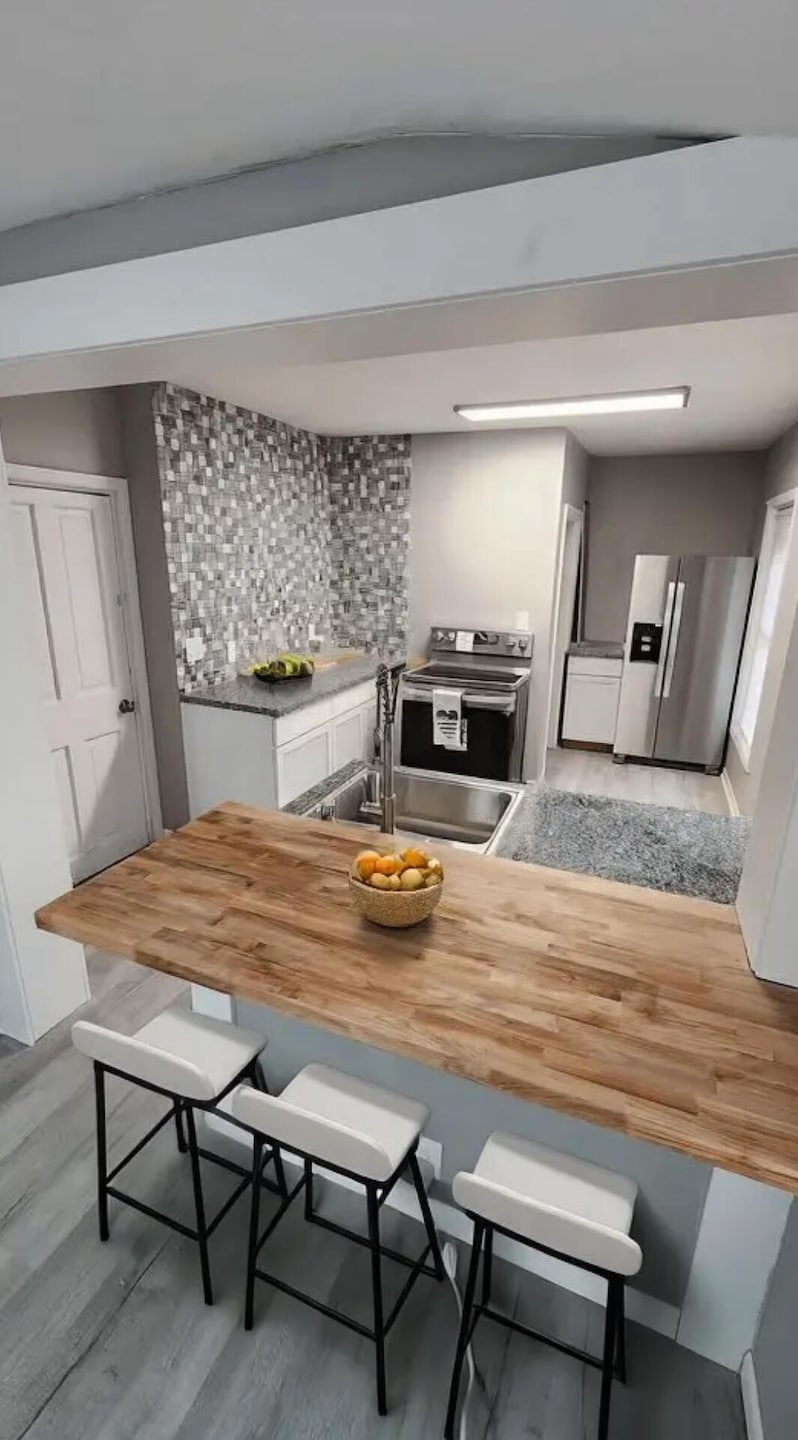
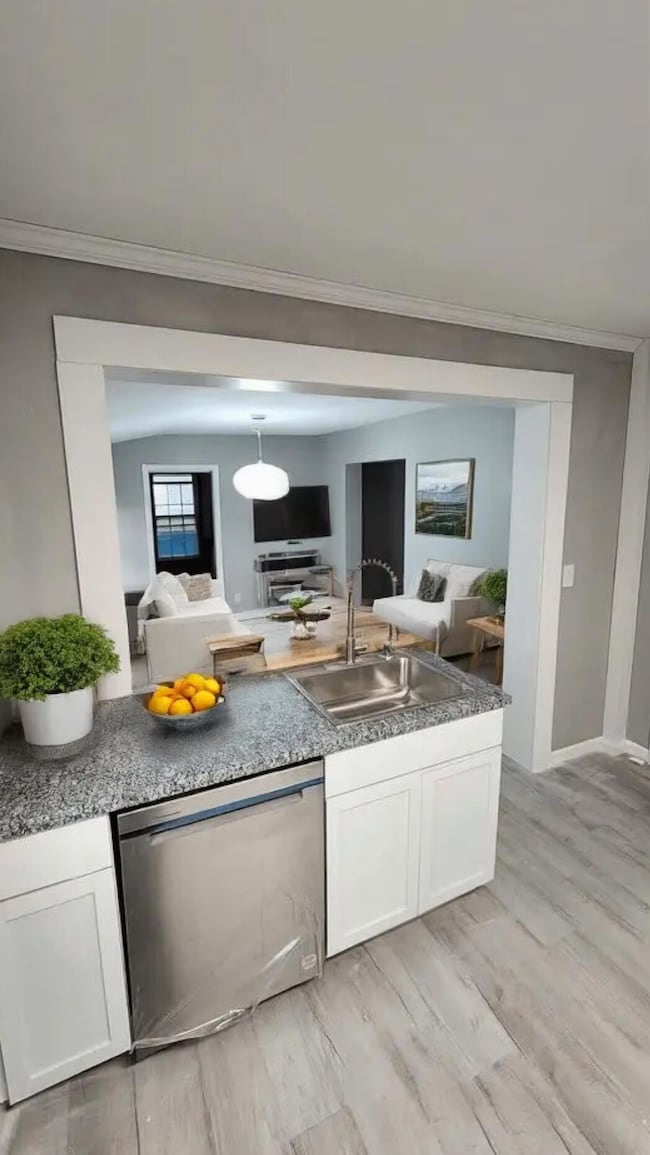
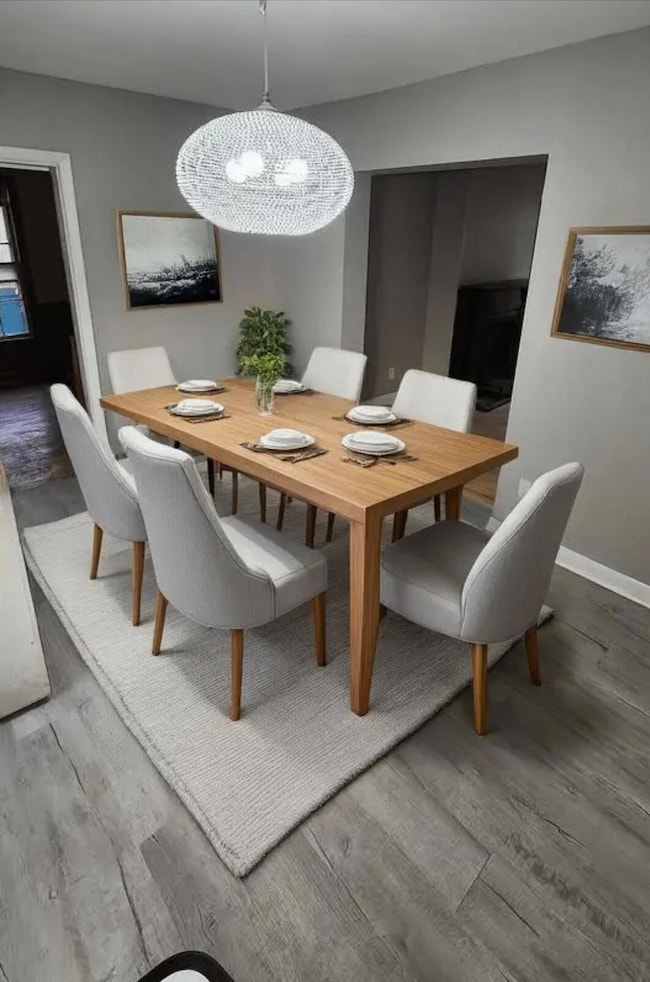
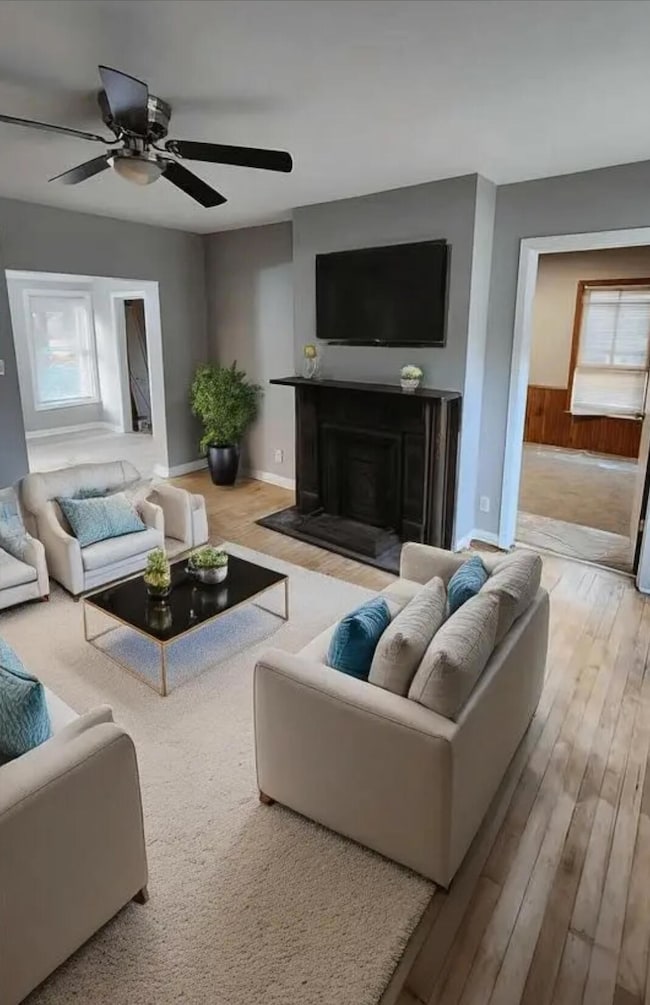
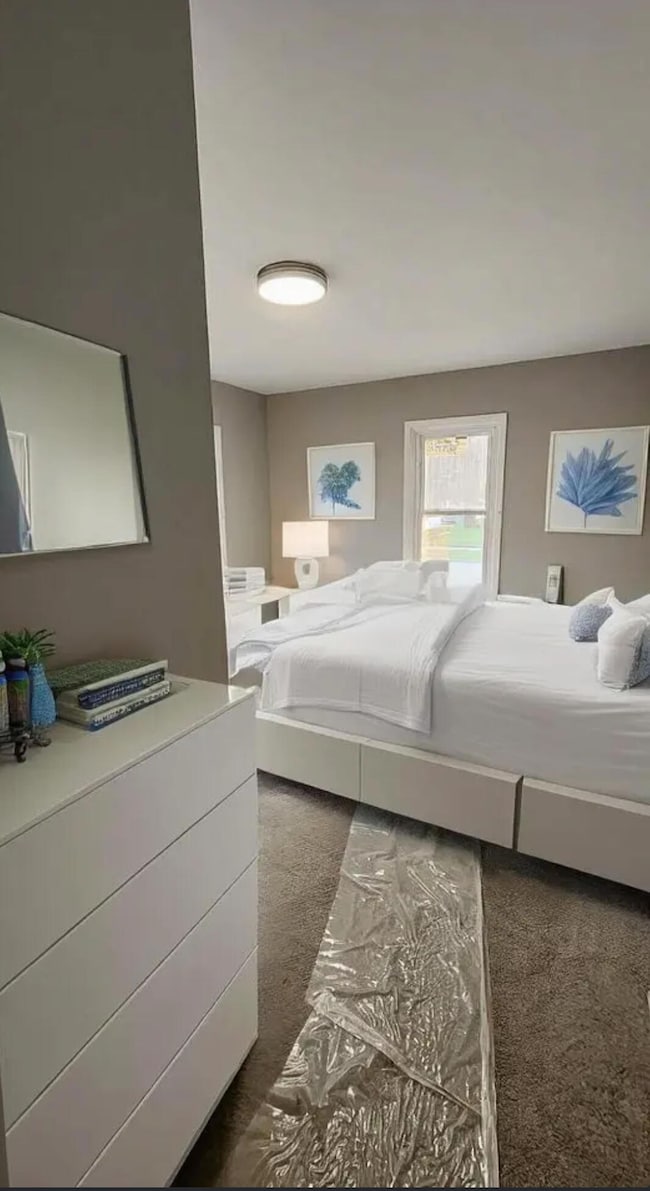
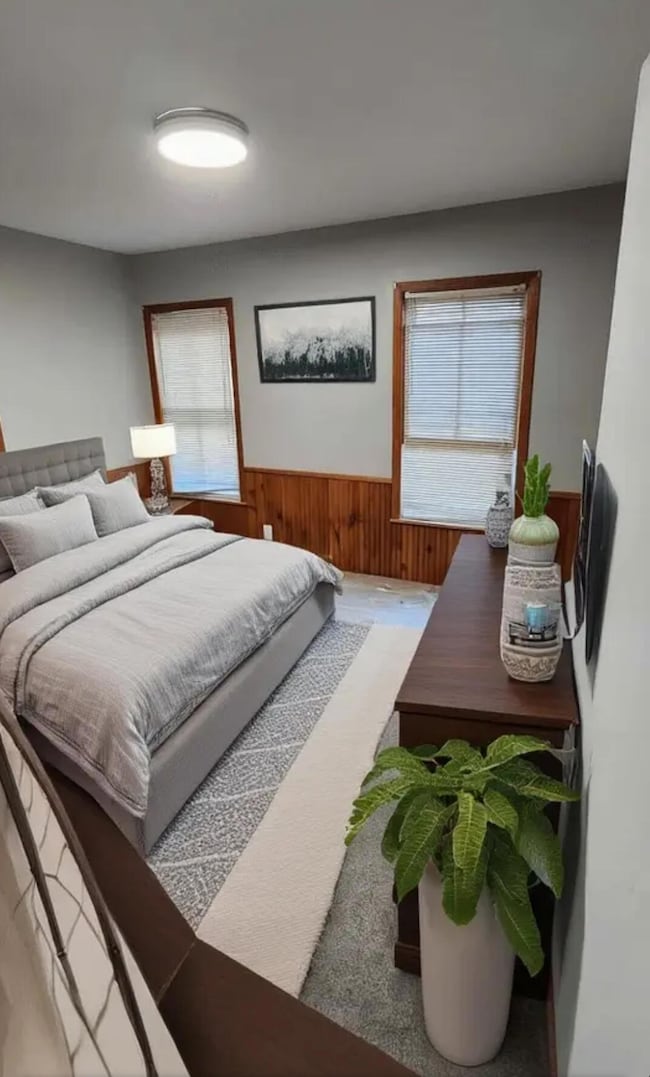
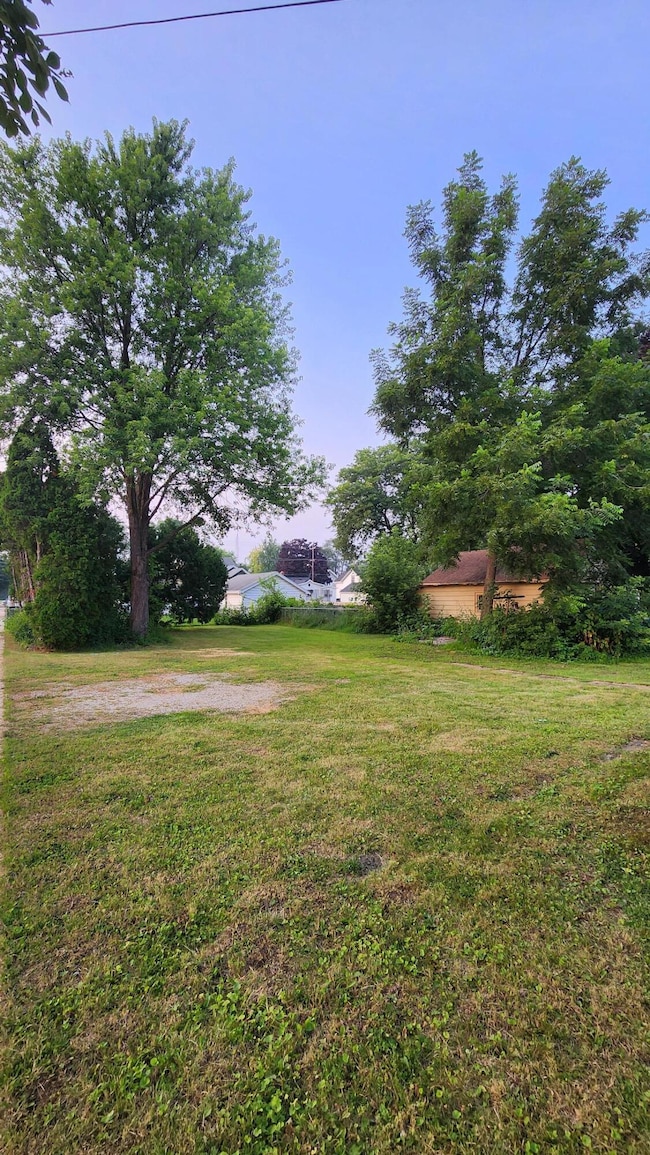
Underpriced investor duplex, desirable location near Lake Winnebago & EAA! This property sits on a large lot with a low-maintenance exterior, vinyl siding, and many new windows. The main floor offers 3-bdrms, a spacious living room with natural wood burning FP & refinished original maple floors. The updated kitchen features white shaker cabinets, granite counters, SS appliances. Breakfast bar in kitchen with butcher block, dining room & new LVP floors. Upstairs is a roomy 2-bdrm unit with an eat-in kitchen. Great Rential location or AirBnb potential. Property needs some finishing. Ideal for cash investors seeking a quick close, Come prepared to be competitive with your offer to win this equity gem. Get there quick before this one's gone. Huge Equity Potential. Comps from $240-$300k
Property Details
Home Type
- Multi-Family
Est. Annual Taxes
- $2,937
Home Design
- Vinyl Siding
Additional Features
- Basement Fills Entire Space Under The House
- 7,405 Sq Ft Lot
Community Details
- Operating Expense $5,160
- Net Operating Income $21,540
Listing and Financial Details
- Assessor Parcel Number 0903540000
Map
Home Values in the Area
Average Home Value in this Area
Tax History
| Year | Tax Paid | Tax Assessment Tax Assessment Total Assessment is a certain percentage of the fair market value that is determined by local assessors to be the total taxable value of land and additions on the property. | Land | Improvement |
|---|---|---|---|---|
| 2024 | $2,937 | $90,700 | $21,400 | $69,300 |
| 2023 | $2,506 | $94,800 | $13,400 | $81,400 |
| 2022 | $2,518 | $94,800 | $13,400 | $81,400 |
| 2021 | $2,314 | $94,800 | $13,400 | $81,400 |
| 2020 | $2,314 | $94,800 | $13,400 | $81,400 |
| 2019 | $2,956 | $94,800 | $13,400 | $81,400 |
| 2018 | $2,893 | $94,800 | $13,400 | $81,400 |
| 2017 | $2,930 | $94,800 | $13,400 | $81,400 |
| 2016 | $3,845 | $87,100 | $13,400 | $73,700 |
| 2015 | $2,729 | $87,100 | $13,400 | $73,700 |
| 2014 | $2,651 | $87,100 | $13,400 | $73,700 |
| 2013 | $2,604 | $87,100 | $13,400 | $73,700 |
Property History
| Date | Event | Price | List to Sale | Price per Sq Ft | Prior Sale |
|---|---|---|---|---|---|
| 12/02/2025 12/02/25 | Price Changed | $156,900 | -1.9% | -- | |
| 11/23/2025 11/23/25 | Price Changed | $159,900 | -3.0% | -- | |
| 11/17/2025 11/17/25 | Price Changed | $164,900 | -1.8% | -- | |
| 11/06/2025 11/06/25 | Price Changed | $167,900 | -2.4% | -- | |
| 09/28/2025 09/28/25 | Price Changed | $172,000 | -4.4% | -- | |
| 08/20/2025 08/20/25 | For Sale | $179,900 | +110.4% | -- | |
| 11/30/2023 11/30/23 | Sold | $85,500 | +7.0% | $42 / Sq Ft | View Prior Sale |
| 11/29/2023 11/29/23 | Pending | -- | -- | -- | |
| 11/08/2023 11/08/23 | For Sale | $79,900 | -- | $39 / Sq Ft |
Purchase History
| Date | Type | Sale Price | Title Company |
|---|---|---|---|
| Warranty Deed | $85,000 | None Listed On Document |
Mortgage History
| Date | Status | Loan Amount | Loan Type |
|---|---|---|---|
| Closed | $157,675 | Construction |
Source: Metro MLS
MLS Number: 1931669
APN: 09-03540000
Disclaimer: Certain information contained herein is derived from information provided by parties other than Homes.com. All information provided is deemed reliable, but is not guaranteed to be accurate and should be independently verified.
![]() IDX information is provided exclusively for personal, non-commercial use, and may not be used for any purpose other than to identify prospective properties consumers may be interested in purchasing.
IDX information is provided exclusively for personal, non-commercial use, and may not be used for any purpose other than to identify prospective properties consumers may be interested in purchasing.
IDX listing data provided by Multiple Listing Service, Inc. Information is supplied by seller and other third parties and has not been verified.
Copyright 2025 – Multiple Listing Service, Inc. – All Rights Reserved.
- 614 Ohio St Unit A
- 405 Michigan St Unit ID1061622P
- 450 W 4th Ave
- 8 W 9th St
- 802 W 11th Ave Unit 802A
- 700 S Main St
- 431 Marion Rd
- 279 Sullivan St
- 417 Marion Rd
- 482 Marion Rd
- 155 Jackson St
- 100 N Main St
- 140 High Ave Unit D
- 495 Pearl Ave
- 151 Dawes St
- 101 Algoma Blvd Unit ID1332436P
- 316 Court St Unit ID1241760P
- 135 Church Ave
- 135 Church Ave
- 502 N Main St Unit ID1253095P
