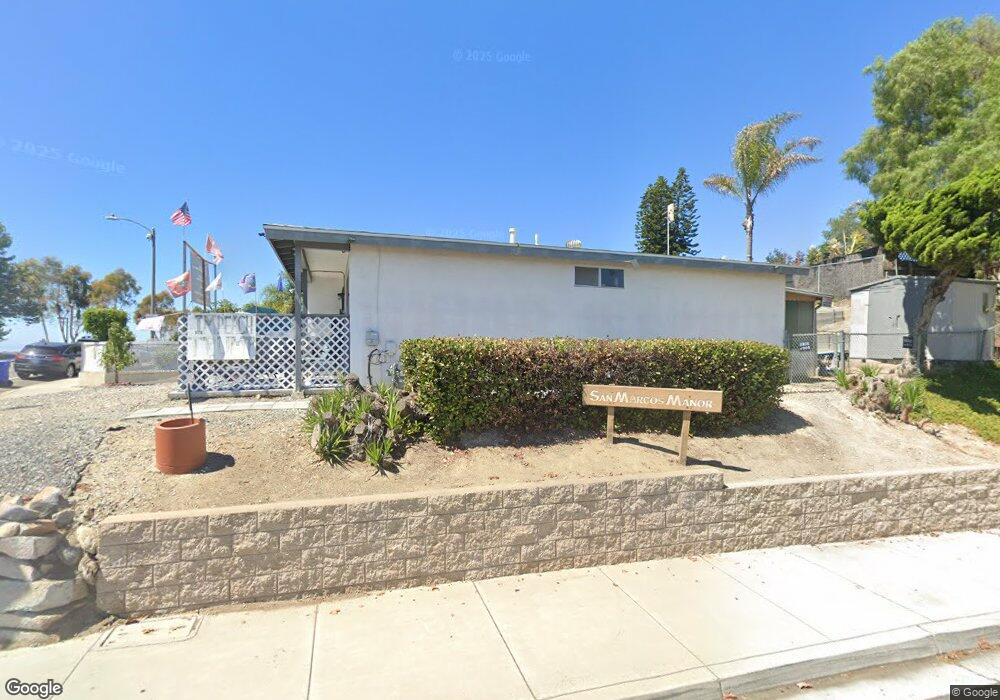
3560 Capalina Rd San Marcos, CA 92069
Estimated Value: $528,040 - $629,000
2
Beds
1
Bath
827
Sq Ft
$689/Sq Ft
Est. Value
About This Home
This home is located at 3560 Capalina Rd, San Marcos, CA 92069 and is currently estimated at $570,010, approximately $689 per square foot. 3560 Capalina Rd is a home located in San Diego County with nearby schools including La Mirada Academy, San Marcos Middle School, and San Marcos High School.
Ownership History
Date
Name
Owned For
Owner Type
Purchase Details
Closed on
Jun 25, 2021
Sold by
Saw Sandra Moh Keat
Bought by
Saw Sandra M and Sandra Saw Separate Property T
Current Estimated Value
Purchase Details
Closed on
Dec 18, 2020
Sold by
Saw Eng C
Bought by
Moh Keat Saw Sandra
Purchase Details
Closed on
Feb 4, 2020
Sold by
Saw Eng C and Eng And Dora Saw Trust
Bought by
Saw Eng C and Eng And Dora Saw Trust
Purchase Details
Closed on
Apr 7, 2010
Sold by
Saw Eng C and Saw Dora K
Bought by
Saw Eng C and Saw Dora K
Purchase Details
Closed on
Mar 20, 2000
Sold by
Saw Eng C and Saw Dora
Bought by
Saw Eng C and Saw Dora K
Home Financials for this Owner
Home Financials are based on the most recent Mortgage that was taken out on this home.
Original Mortgage
$66,950
Interest Rate
8.34%
Purchase Details
Closed on
Feb 18, 1994
Sold by
Saw Eng C and Saw Dora
Bought by
Saw Eng C and Saw Dora K
Purchase Details
Closed on
Jan 13, 1992
Purchase Details
Closed on
Jun 9, 1988
Create a Home Valuation Report for This Property
The Home Valuation Report is an in-depth analysis detailing your home's value as well as a comparison with similar homes in the area
Home Values in the Area
Average Home Value in this Area
Purchase History
| Date | Buyer | Sale Price | Title Company |
|---|---|---|---|
| Saw Sandra M | -- | None Available | |
| Moh Keat Saw Sandra | -- | None Available | |
| Saw Eng C | -- | None Listed On Document | |
| Saw Eng C | -- | None Available | |
| Saw Eng C | -- | None Available | |
| Saw Eng C | -- | None Available | |
| Saw Eng C | -- | New Century Title Company | |
| Saw Eng C | -- | New Century Title Company | |
| Saw Eng C | -- | -- | |
| -- | $111,000 | -- | |
| -- | $65,000 | -- |
Source: Public Records
Mortgage History
| Date | Status | Borrower | Loan Amount |
|---|---|---|---|
| Previous Owner | Saw Eng C | $66,950 |
Source: Public Records
Tax History Compared to Growth
Tax History
| Year | Tax Paid | Tax Assessment Tax Assessment Total Assessment is a certain percentage of the fair market value that is determined by local assessors to be the total taxable value of land and additions on the property. | Land | Improvement |
|---|---|---|---|---|
| 2025 | $2,158 | $196,252 | $106,086 | $90,166 |
| 2024 | $2,158 | $192,405 | $104,006 | $88,399 |
| 2023 | $2,739 | $188,633 | $101,967 | $86,666 |
| 2022 | $2,089 | $184,935 | $99,968 | $84,967 |
| 2021 | $2,676 | $181,309 | $98,008 | $83,301 |
| 2020 | $2,657 | $179,451 | $97,004 | $82,447 |
| 2019 | $2,634 | $175,933 | $95,102 | $80,831 |
| 2018 | $1,949 | $172,485 | $93,238 | $79,247 |
| 2017 | $1,909 | $169,104 | $91,410 | $77,694 |
| 2016 | $1,880 | $165,789 | $89,618 | $76,171 |
| 2015 | $1,853 | $163,299 | $88,272 | $75,027 |
| 2014 | $1,811 | $160,101 | $86,543 | $73,558 |
Source: Public Records
Map
Nearby Homes
- 3511 Badillo Rd
- 3435 Capalina Rd Unit 10
- 1515 Capalina Rd Unit 42
- 1515 Capalina Rd Unit 71
- 1682 Saddlehorn Dr
- 155 Las Flores Dr Unit 36
- 155 Las Flores Dr Unit 136
- 155 Las Flores Dr Unit 25
- 302 N Pacific St
- 150 S Rancho Santa fe Rd Unit SPC 38
- 3355 Descanso Ave
- 507 Avenida Blanco
- 2407 Saltbush Dr
- 2207 Saltbush Dr
- 2406 Saltbush Dr
- 2206 Saltbush Dr
- 2005 Saltbush Dr
- 2204 Saltbush Dr
- 2203 Saltbush Dr
- 2003 Saltbush Dr
- 3558 Capalina Rd
- 3550 Capalina Rd
- 3552 Capalina Rd
- 3568 De Leone Rd
- 3564 De Leone Rd
- 3562 De Leone Rd
- 7 Capalina Rd
- 3542 Capalina Rd
- 3544 Capalina Rd
- 3572 De Leone Rd
- 3570 De Leone Rd
- 3560 De Leone Rd
- 3558 De Leone Rd
- 3534 Capalina Rd
- 3536 Capalina Rd
- 3548 Hollencrest Rd Unit 1
- 3550 Hollencrest Rd
- 3557 De Leone Rd
- 3555 De Leone Rd
- 3554 De Leone Rd