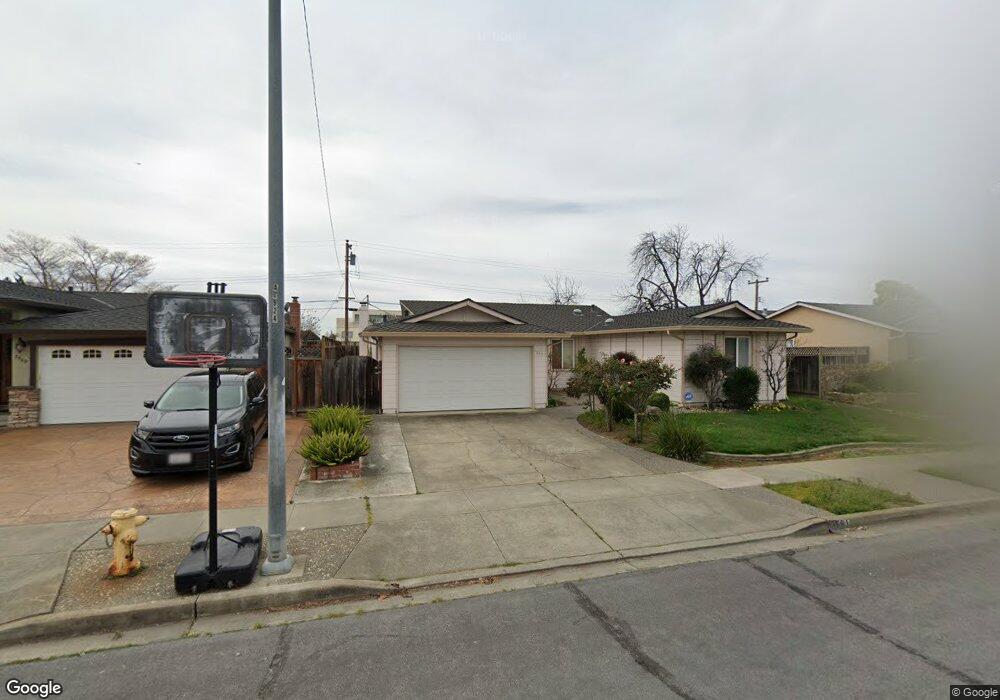
3561 Sutton Loop Fremont, CA 94536
Centerville District NeighborhoodEstimated Value: $1,586,868 - $1,972,000
4
Beds
2
Baths
1,860
Sq Ft
$934/Sq Ft
Est. Value
About This Home
This home is located at 3561 Sutton Loop, Fremont, CA 94536 and is currently estimated at $1,737,467, approximately $934 per square foot. 3561 Sutton Loop is a home located in Alameda County with nearby schools including Parkmont Elementary School, Centerville Junior High School, and Washington High School.
Ownership History
Date
Name
Owned For
Owner Type
Purchase Details
Closed on
Sep 15, 2004
Sold by
Strickland David C and Strickland Claudia
Bought by
Lee Harry G
Current Estimated Value
Home Financials for this Owner
Home Financials are based on the most recent Mortgage that was taken out on this home.
Original Mortgage
$440,000
Outstanding Balance
$185,199
Interest Rate
3.66%
Mortgage Type
Negative Amortization
Estimated Equity
$1,552,268
Purchase Details
Closed on
Feb 26, 1997
Sold by
Simnitt John T and Simnitt Cheryl A
Bought by
Strickland David C and Strickland Claudia
Home Financials for this Owner
Home Financials are based on the most recent Mortgage that was taken out on this home.
Original Mortgage
$222,280
Interest Rate
7.86%
Create a Home Valuation Report for This Property
The Home Valuation Report is an in-depth analysis detailing your home's value as well as a comparison with similar homes in the area
Home Values in the Area
Average Home Value in this Area
Purchase History
| Date | Buyer | Sale Price | Title Company |
|---|---|---|---|
| Lee Harry G | $590,000 | Chicago Title Co | |
| Strickland David C | $278,000 | Old Republic Title Company |
Source: Public Records
Mortgage History
| Date | Status | Borrower | Loan Amount |
|---|---|---|---|
| Open | Lee Harry G | $440,000 | |
| Previous Owner | Strickland David C | $222,280 |
Source: Public Records
Tax History
| Year | Tax Paid | Tax Assessment Tax Assessment Total Assessment is a certain percentage of the fair market value that is determined by local assessors to be the total taxable value of land and additions on the property. | Land | Improvement |
|---|---|---|---|---|
| 2025 | $9,874 | $815,330 | $246,699 | $575,631 |
| 2024 | $9,874 | $799,210 | $241,863 | $564,347 |
| 2023 | $9,608 | $790,404 | $237,121 | $553,283 |
| 2022 | $9,482 | $767,911 | $232,473 | $542,438 |
| 2021 | $9,249 | $752,718 | $227,915 | $531,803 |
| 2020 | $9,272 | $751,930 | $225,579 | $526,351 |
| 2019 | $9,165 | $737,192 | $221,157 | $516,035 |
| 2018 | $8,986 | $722,743 | $216,823 | $505,920 |
| 2017 | $8,760 | $708,577 | $212,573 | $496,004 |
| 2016 | $8,610 | $694,688 | $208,406 | $486,282 |
| 2015 | $8,495 | $684,257 | $205,277 | $478,980 |
| 2014 | $8,348 | $670,858 | $201,257 | $469,601 |
Source: Public Records
Map
Nearby Homes
- 3623 Sutton Loop
- 3665 Oxford Common
- 3810 Burton Common
- 3833 Burton Common
- 3867 Burton Common
- 3046 Greenwood Dr
- 3554 Shadowbrook Terrace
- 37856 Bright Common
- 3041 Christine Ct
- 37470 Parish Cir Unit 19C
- 37445 Currant Terrace
- 37434 Hazel Terrace
- 3291 Foxtail Terrace
- 37429 Fremont Blvd
- 37616 Pimento Common
- 37311 Aspenwood Common Unit 203
- 3232 Red Cedar Terrace Unit LU15
- 3550 Buttonwood Terrace Unit 111
- 38048 Palmer Dr
- 3685 Nutwood Terrace Unit 313
- 3569 Sutton Loop
- 3553 Sutton Loop
- 3549 Sutton Loop
- 3577 Sutton Loop
- 3545 Sutton Loop
- 3566 Sutton Loop
- 3548 Sutton Loop
- 3585 Sutton Loop
- 3574 Sutton Loop
- 3541 Sutton Loop
- 3542 Sutton Loop
- 3582 Sutton Loop
- 2345 Aton
- 3591 Sutton Loop
- 3352 Alton Ct
- 3538 Sutton Loop
- 3353 Alton Ct
- 3638 Sutton Loop
- 3537 Sutton Loop
- 3599 Sutton Loop
Your Personal Tour Guide
Ask me questions while you tour the home.