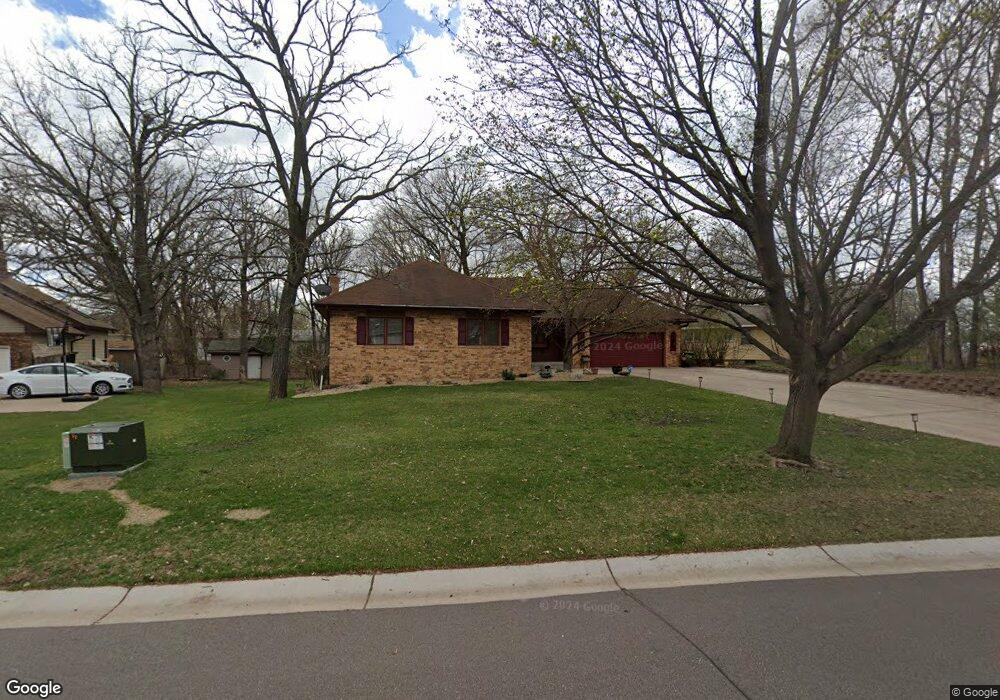
3562 115th Ln NW Coon Rapids, MN 55433
Estimated Value: $403,000 - $461,708
3
Beds
3
Baths
3,000
Sq Ft
$145/Sq Ft
Est. Value
About This Home
This home is located at 3562 115th Ln NW, Coon Rapids, MN 55433 and is currently estimated at $436,427, approximately $145 per square foot. 3562 115th Ln NW is a home located in Anoka County with nearby schools including Lucile Bruner Elementary School, Mississippi Elementary School, and Laughlin Junior/Senior High School.
Ownership History
Date
Name
Owned For
Owner Type
Purchase Details
Closed on
Jul 13, 2022
Sold by
Gamm David and Gamm Shirley
Bought by
Fufa Aurelia and Fufa Teferi
Current Estimated Value
Home Financials for this Owner
Home Financials are based on the most recent Mortgage that was taken out on this home.
Original Mortgage
$180,000
Outstanding Balance
$171,249
Interest Rate
5.09%
Mortgage Type
New Conventional
Estimated Equity
$265,178
Purchase Details
Closed on
Dec 30, 2004
Sold by
Mccabe Jackie W and Mccabe Karen L
Bought by
Gamm David and Gamm Shirley
Purchase Details
Closed on
Sep 22, 1998
Sold by
Johnson Edward Robert and Johnson Judith V
Bought by
Mccabe Jackie W and Mccabe Karen L
Create a Home Valuation Report for This Property
The Home Valuation Report is an in-depth analysis detailing your home's value as well as a comparison with similar homes in the area
Home Values in the Area
Average Home Value in this Area
Purchase History
| Date | Buyer | Sale Price | Title Company |
|---|---|---|---|
| Fufa Aurelia | $440,000 | -- | |
| Gamm David | $295,000 | -- | |
| Mccabe Jackie W | $179,900 | -- |
Source: Public Records
Mortgage History
| Date | Status | Borrower | Loan Amount |
|---|---|---|---|
| Open | Fufa Aurelia | $180,000 |
Source: Public Records
Tax History Compared to Growth
Tax History
| Year | Tax Paid | Tax Assessment Tax Assessment Total Assessment is a certain percentage of the fair market value that is determined by local assessors to be the total taxable value of land and additions on the property. | Land | Improvement |
|---|---|---|---|---|
| 2025 | $4,596 | $439,600 | $94,500 | $345,100 |
| 2024 | $4,596 | $430,100 | $91,400 | $338,700 |
| 2023 | $4,120 | $426,200 | $70,400 | $355,800 |
| 2022 | $4,081 | $415,300 | $70,400 | $344,900 |
| 2021 | $3,904 | $365,800 | $68,300 | $297,500 |
| 2020 | $3,928 | $343,000 | $62,000 | $281,000 |
| 2019 | $3,653 | $331,000 | $64,100 | $266,900 |
| 2018 | $3,599 | $300,800 | $0 | $0 |
| 2017 | $3,225 | $287,600 | $0 | $0 |
| 2016 | $3,286 | $254,500 | $0 | $0 |
| 2015 | -- | $254,500 | $48,300 | $206,200 |
| 2014 | -- | $221,200 | $38,100 | $183,100 |
Source: Public Records
Map
Nearby Homes
- 3501 115th Ln NW
- 11901 Vintage St NW
- 11927 Vintage St NW
- 11984 Orchid St NW
- 3649 121st Ave NW
- 3020 117th Ave NW
- 6505 119th Place N
- 11601 9th Ave NW
- 2862 116th Ave NW
- 3074 121st Ave NW
- 12189 Lily St NW
- 2851 113th Ave NW
- 1015 South St
- 7101 120th Ave N
- 4193 119th Ln NW
- 1224 8th Ln
- 11749 Crooked Lake Blvd NW
- 6802 117th Ave N
- 2965 108th Ln NW
- 1319 7th Ln
- 3566 115th Ln NW
- 3554 115th Ln NW
- 3551 Coon Rapids Blvd NW
- 11570 Silverod St NW
- 3541 Coon Rapids Blvd NW
- 3518 115th Ln NW
- 11581 Tulip St NW
- 11571 Silverod St NW
- 3510 115th Ln NW
- 11590 Silverod St NW
- 3502 115th Ln NW
- 11591 Tulip St NW
- 3531 Coon Rapids Blvd NW
- 11591 Silverod St NW
- 3515 115th Ln NW
- 11601 Tulip St NW
- xxx 115th Ln
- 35xx 115th Ln NW
- 3xxx 115th Ln NW
- 11600 Silverod St NW