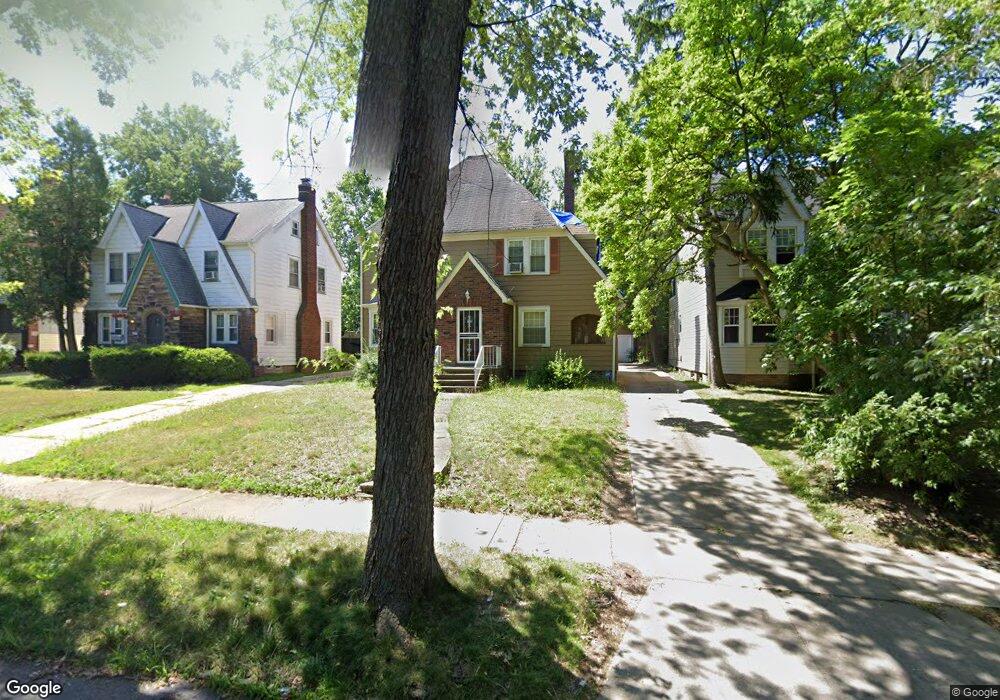
3562 Berkeley Rd Cleveland, OH 44118
Estimated Value: $172,000 - $236,000
4
Beds
2
Baths
1,466
Sq Ft
$138/Sq Ft
Est. Value
About This Home
This home is located at 3562 Berkeley Rd, Cleveland, OH 44118 and is currently estimated at $201,738, approximately $137 per square foot. 3562 Berkeley Rd is a home located in Cuyahoga County with nearby schools including Noble Elementary School, Monticello Middle School, and Cleveland Heights High School.
Ownership History
Date
Name
Owned For
Owner Type
Purchase Details
Closed on
Feb 21, 2024
Sold by
Fisher Homes Llc
Bought by
Ccc Investment Group Llc
Current Estimated Value
Purchase Details
Closed on
Dec 23, 2018
Sold by
Payden Michael
Bought by
Fisher Homes Llc
Purchase Details
Closed on
Feb 26, 2016
Sold by
Payden Michael
Bought by
Payden Linda
Purchase Details
Closed on
Jan 25, 2015
Sold by
Payden Champion Paula Yvonne and Champion Jason
Bought by
Payden Linda Cordelia
Purchase Details
Closed on
Jul 19, 2001
Sold by
Payden Henry J
Bought by
Payden Henry J and Champion Paula Yvonne Payden
Purchase Details
Closed on
Dec 31, 1996
Sold by
King Henrietta
Bought by
Payden Henry
Purchase Details
Closed on
Mar 6, 1990
Sold by
White Robert L
Bought by
King Henrietta
Purchase Details
Closed on
May 14, 1985
Sold by
White Adela C
Bought by
White Robert L
Purchase Details
Closed on
Jan 1, 1975
Bought by
White Adela C
Create a Home Valuation Report for This Property
The Home Valuation Report is an in-depth analysis detailing your home's value as well as a comparison with similar homes in the area
Home Values in the Area
Average Home Value in this Area
Purchase History
| Date | Buyer | Sale Price | Title Company |
|---|---|---|---|
| Ccc Investment Group Llc | -- | None Listed On Document | |
| Fisher Homes Llc | $103,900 | None Available | |
| Payden Linda | $107,600 | Attorney | |
| Payden Linda Cordelia | -- | None Available | |
| Payden Henry J | -- | -- | |
| Payden Henry | $63,000 | -- | |
| King Henrietta | $63,000 | -- | |
| White Robert L | -- | -- | |
| White Adela C | -- | -- |
Source: Public Records
Tax History
| Year | Tax Paid | Tax Assessment Tax Assessment Total Assessment is a certain percentage of the fair market value that is determined by local assessors to be the total taxable value of land and additions on the property. | Land | Improvement |
|---|---|---|---|---|
| 2025 | $5,727 | $65,100 | $11,445 | $53,655 |
| 2024 | $5,638 | $65,100 | $11,445 | $53,655 |
| 2023 | $5,257 | $45,090 | $9,280 | $35,810 |
| 2022 | $4,983 | $45,080 | $9,275 | $35,805 |
| 2021 | $4,886 | $45,080 | $9,280 | $35,810 |
| 2020 | $4,650 | $36,370 | $7,490 | $28,880 |
| 2019 | $4,132 | $103,900 | $21,400 | $82,500 |
| 2018 | $4,819 | $36,370 | $7,490 | $28,880 |
| 2017 | $4,592 | $37,660 | $6,650 | $31,010 |
| 2016 | $4,741 | $37,660 | $6,650 | $31,010 |
| 2015 | $12,532 | $37,660 | $6,650 | $31,010 |
| 2014 | $6,640 | $40,500 | $7,140 | $33,360 |
Source: Public Records
Map
Nearby Homes
- 3540 Berkeley Rd
- 3498 Bainbridge Rd
- 3484 Bainbridge Rd
- 1924 Powell Ave
- 3699 Bainbridge Rd
- 3483 Severn Rd
- 3575 Grosvenor Rd
- 3599 Grosvenor Rd
- 1948 Staunton Rd
- 3430 Beechwood Ave
- 1936 Revere Rd
- 3738 Bendemeer Rd
- 3423 Beechwood Ave
- 3750 Bainbridge Rd
- 3668 Grosvenor Rd
- 3388 Beechwood Ave Unit 2
- 3412 Euclid Heights Blvd
- 3733 E Antisdale Rd
- 1985 Revere Rd
- 3730 E Antisdale Rd
- 3568 Berkeley Rd
- 3558 Berkeley Rd
- 3572 Berkeley Rd
- 3554 Berkeley Rd
- 3563 Bainbridge Rd
- 3567 Bainbridge Rd
- 3559 Bainbridge Rd
- 3576 Berkeley Rd
- 3548 Berkeley Rd
- 3571 Bainbridge Rd
- 3555 Bainbridge Rd
- 3575 Bainbridge Rd
- 3563 Berkeley Rd
- 3582 Berkeley Rd
- 3549 Bainbridge Rd
- 3567 Berkeley Rd
- 3555 Berkeley Rd
- 3579 Bainbridge Rd
- 3573 Berkeley Rd
- 3549 Berkeley Rd
Your Personal Tour Guide
Ask me questions while you tour the home.