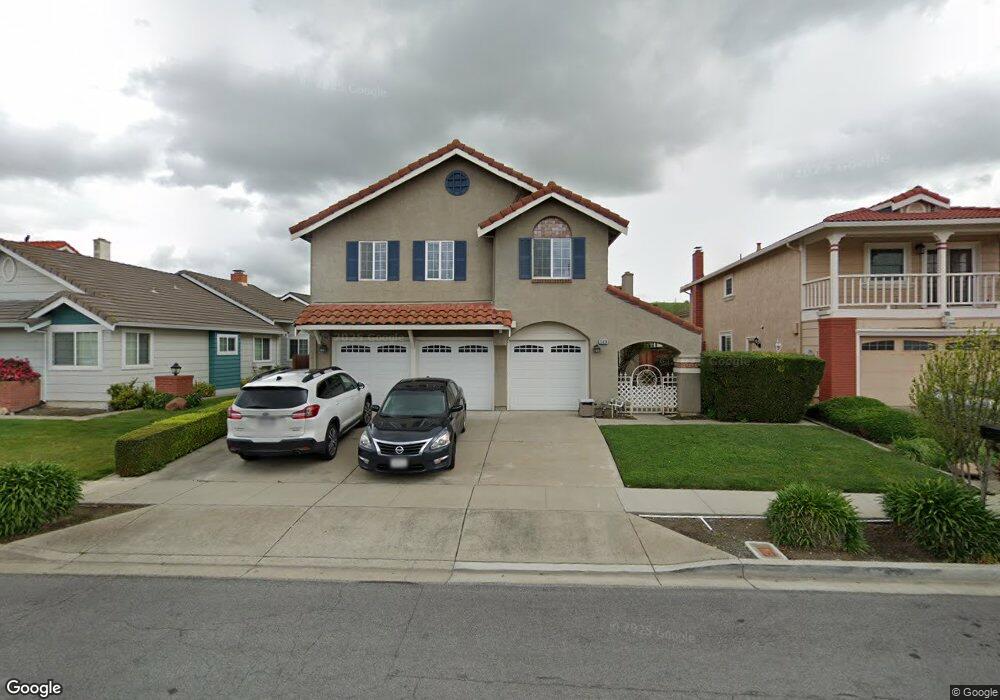
35638 Beeching Ln Fremont, CA 94536
Brookvale NeighborhoodEstimated Value: $2,114,000 - $2,503,000
4
Beds
3
Baths
2,975
Sq Ft
$790/Sq Ft
Est. Value
About This Home
This home is located at 35638 Beeching Ln, Fremont, CA 94536 and is currently estimated at $2,349,950, approximately $789 per square foot. 35638 Beeching Ln is a home located in Alameda County with nearby schools including Brookvale Elementary School, Thornton Middle School, and American High School.
Ownership History
Date
Name
Owned For
Owner Type
Purchase Details
Closed on
Sep 21, 2021
Sold by
Tchao Joel C and Hew Jennifer L
Bought by
Tchao Joel and Hew Jennifer
Current Estimated Value
Home Financials for this Owner
Home Financials are based on the most recent Mortgage that was taken out on this home.
Original Mortgage
$548,250
Outstanding Balance
$498,867
Interest Rate
2.8%
Mortgage Type
New Conventional
Estimated Equity
$1,851,083
Purchase Details
Closed on
Mar 8, 2013
Sold by
Lo Johnny and Lo Polin
Bought by
Tchao Joel C and Hew Jennifer L
Home Financials for this Owner
Home Financials are based on the most recent Mortgage that was taken out on this home.
Original Mortgage
$680,000
Interest Rate
3.53%
Mortgage Type
New Conventional
Purchase Details
Closed on
Apr 26, 2012
Sold by
Lo Johnny and Lo Polin
Bought by
Lo Johnny and Lo Polin
Home Financials for this Owner
Home Financials are based on the most recent Mortgage that was taken out on this home.
Original Mortgage
$350,000
Interest Rate
4.05%
Mortgage Type
New Conventional
Create a Home Valuation Report for This Property
The Home Valuation Report is an in-depth analysis detailing your home's value as well as a comparison with similar homes in the area
Home Values in the Area
Average Home Value in this Area
Purchase History
| Date | Buyer | Sale Price | Title Company |
|---|---|---|---|
| Tchao Joel | -- | Provident Title Company | |
| Tchao Joel C | $862,500 | Old Republic Title Company | |
| Lo Johnny | -- | First American Title |
Source: Public Records
Mortgage History
| Date | Status | Borrower | Loan Amount |
|---|---|---|---|
| Open | Tchao Joel | $548,250 | |
| Closed | Tchao Joel C | $680,000 | |
| Previous Owner | Lo Johnny | $350,000 |
Source: Public Records
Tax History
| Year | Tax Paid | Tax Assessment Tax Assessment Total Assessment is a certain percentage of the fair market value that is determined by local assessors to be the total taxable value of land and additions on the property. | Land | Improvement |
|---|---|---|---|---|
| 2025 | $12,616 | $1,062,064 | $320,158 | $741,906 |
| 2024 | $12,616 | $1,041,244 | $313,882 | $727,362 |
| 2023 | $12,285 | $1,020,828 | $307,728 | $713,100 |
| 2022 | $12,135 | $1,000,818 | $301,696 | $699,122 |
| 2021 | $11,836 | $981,197 | $295,781 | $685,416 |
| 2020 | $11,898 | $971,139 | $292,749 | $678,390 |
| 2019 | $11,761 | $952,104 | $287,011 | $665,093 |
| 2018 | $11,534 | $933,440 | $281,385 | $652,055 |
| 2017 | $11,246 | $915,137 | $275,867 | $639,270 |
| 2016 | $11,061 | $897,197 | $270,459 | $626,738 |
| 2015 | $10,919 | $883,725 | $266,398 | $617,327 |
| 2014 | $10,736 | $866,415 | $261,180 | $605,235 |
Source: Public Records
Map
Nearby Homes
- 2102 Farrol Ave
- 35037 Begonia St
- 35530 Monterra Terrace Unit 303
- 34839 Clover St
- 690 Kraftile Ct
- 34819 Clover St
- 2203 Peacock Place Unit 1
- 3264 Mackenzie Place
- 2201 Partridge Way Unit 2
- 357 Sunnyslope Dr
- 2921 Daisy Ct
- 36017 Plumeria Way
- 36421 Bendel Terrace
- 2655 Barrington Terrace
- 36500 Alder Ct
- 310 Grau Dr
- 34926 Moina Shaiq Common
- 116 Mahogany Ln
- 35172 King Ct
- 36004 Vallee Terrace
- 35646 Beeching Ln
- 35630 Beeching Ln
- 35639 Barnard Dr
- 35631 Barnard Dr
- 35654 Beeching Ln
- 35622 Beeching Ln
- 35647 Barnard Dr
- 35623 Barnard Dr
- 35645 Beeching Ln
- 35637 Beeching Ln
- 35662 Beeching Ln
- 35653 Beeching Ln
- 35655 Barnard Dr
- 35614 Beeching Ln
- 35615 Barnard Dr
- 35629 Beeching Ln
- 35661 Beeching Ln
- 35663 Barnard Dr
- 35670 Beeching Ln
- 35621 Beeching Ln
Your Personal Tour Guide
Ask me questions while you tour the home.