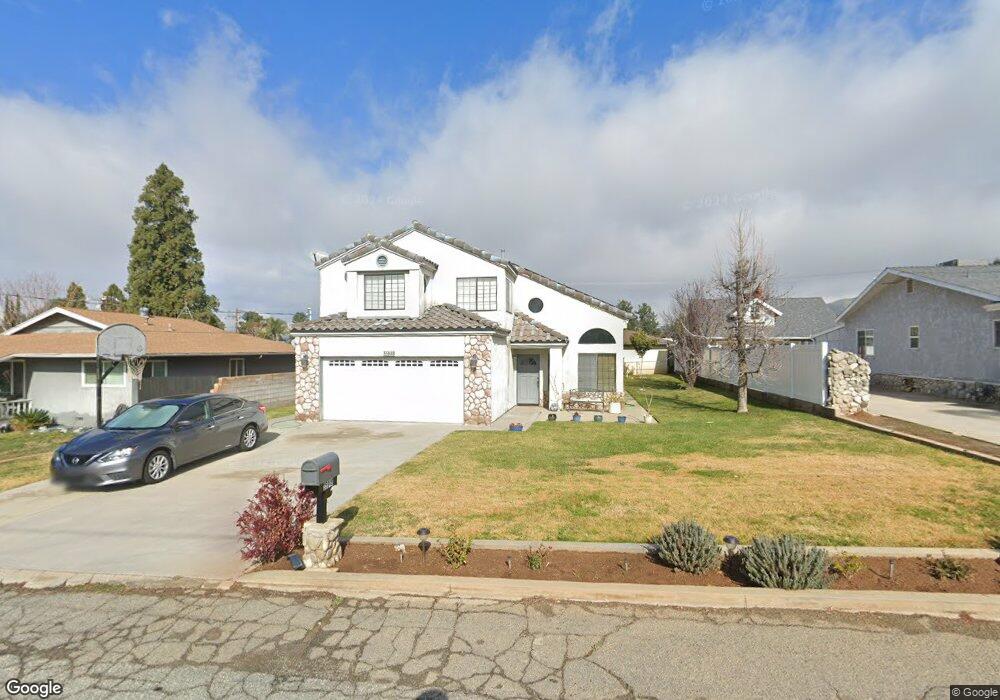
35648 Barbara Ln Yucaipa, CA 92399
Estimated Value: $560,823 - $666,000
3
Beds
3
Baths
2,380
Sq Ft
$257/Sq Ft
Est. Value
About This Home
This home is located at 35648 Barbara Ln, Yucaipa, CA 92399 and is currently estimated at $611,206, approximately $256 per square foot. 35648 Barbara Ln is a home located in San Bernardino County with nearby schools including Wildwood Elementary School, Mesa View Middle School, and Yucaipa High School.
Ownership History
Date
Name
Owned For
Owner Type
Purchase Details
Closed on
Oct 14, 2020
Sold by
Ayala Susan B
Bought by
Ayala Susan B and Cadena Mario Joseph
Current Estimated Value
Home Financials for this Owner
Home Financials are based on the most recent Mortgage that was taken out on this home.
Original Mortgage
$317,400
Interest Rate
3.05%
Mortgage Type
New Conventional
Purchase Details
Closed on
Oct 26, 2007
Sold by
Ayala Susan B
Bought by
Ayala Susan B
Purchase Details
Closed on
Feb 24, 2003
Sold by
Ayala Cadena Susan Beth
Bought by
Cadena Susan Beth Ayala
Home Financials for this Owner
Home Financials are based on the most recent Mortgage that was taken out on this home.
Original Mortgage
$187,500
Interest Rate
5.93%
Purchase Details
Closed on
Dec 13, 2002
Sold by
Cadena Mario Mark
Bought by
Ayala Cadena Susan Beth
Create a Home Valuation Report for This Property
The Home Valuation Report is an in-depth analysis detailing your home's value as well as a comparison with similar homes in the area
Home Values in the Area
Average Home Value in this Area
Purchase History
| Date | Buyer | Sale Price | Title Company |
|---|---|---|---|
| Ayala Susan B | -- | Amrock | |
| Ayala Susan B | -- | None Available | |
| Cadena Susan Beth Ayala | -- | Commonwealth Title | |
| Ayala Cadena Susan Beth | -- | -- |
Source: Public Records
Mortgage History
| Date | Status | Borrower | Loan Amount |
|---|---|---|---|
| Previous Owner | Ayala Susan B | $317,400 | |
| Previous Owner | Cadena Susan Beth Ayala | $187,500 |
Source: Public Records
Tax History Compared to Growth
Tax History
| Year | Tax Paid | Tax Assessment Tax Assessment Total Assessment is a certain percentage of the fair market value that is determined by local assessors to be the total taxable value of land and additions on the property. | Land | Improvement |
|---|---|---|---|---|
| 2025 | $2,848 | $221,117 | $50,761 | $170,356 |
| 2024 | $2,848 | $216,782 | $49,766 | $167,016 |
| 2023 | $2,767 | $212,531 | $48,790 | $163,741 |
| 2022 | $2,714 | $208,363 | $47,833 | $160,530 |
| 2021 | $2,665 | $204,277 | $46,895 | $157,382 |
| 2020 | $2,676 | $202,182 | $46,414 | $155,768 |
| 2019 | $2,582 | $198,218 | $45,504 | $152,714 |
| 2018 | $2,293 | $194,332 | $44,612 | $149,720 |
| 2017 | $2,242 | $190,521 | $43,737 | $146,784 |
| 2016 | $2,211 | $186,785 | $42,879 | $143,906 |
| 2015 | $2,187 | $183,979 | $42,235 | $141,744 |
| 2014 | $2,142 | $180,375 | $41,408 | $138,967 |
Source: Public Records
Map
Nearby Homes
- 35683 Wildwood Canyon Rd
- 35476 Wildwood Canyon Rd
- 35451 Wildwood Canyon Rd
- 35816 Wildwood Canyon Rd
- 35676 Lynfall St
- 35438 Cabrini Dr
- 35750 Brookwood Ct
- 35710 Avenue H
- 35408 Cabrini Dr
- 35550 Bella Vista Dr
- 35879 Wildwood Crest Dr
- 35883 Wildwood Crest Dr
- 35885 Wildwood Crest Dr
- 0 Brookwood Ct
- 13010 Monterey Dr
- 3411 Wildwood Canyon Rd Unit Space 10
- 34529 Wildwood Canyon Rd
- 12780 Blossom Ave
- 13288 Bryant St
- 13514 Big Sky Ct
- 35640 Barbara Ln
- 35620 Barbara Ln
- 35637 Wildwood Canyon Rd
- 35651 Wildwood Canyon Rd
- 35621 Wildwood Canyon Rd
- 35649 Barbara Ln
- 35606 Barbara Ln
- 35665 Wildwood Canyon Rd
- 35651 Barbara Ln
- 35656 Barbara Ln
- 35615 Wildwood Canyon Rd
- 35641 Barbara Ln
- 35592 Barbara Ln
- 35671 Wildwood Canyon Rd
- 35591 Barbara Ln
- 35587 Wildwood Canyon Rd
- 35640 Wildwood Canyon Rd
- 35638 Wildwood Canyon Rd
- 35618 Wildwood Canyon Rd
- 35586 Barbara Ln